Sante DICOM Viewer CD/DVD
Quick start guide
Copyright © 2026 Santesoft LTD , all rights reserved
Table of Contents
- Overview
- User Interface
- Main Window Modes (4)
- Customize the Toolbars
- Load a Series into the Main Window
- Set the Active Series
- Unload a Series from the Main Window
- Close a Series
- The Series Mode
- The MPR Mode
- The 3D Model Mode
- Compare Images from Different Series
- Compare Images from the Same Series
- Take Calibrated Ultrasound Measurements
- Program Options
- Program Tools
- Pan Hand
- Level-Window
- Frame Browser
- Zoom In/Out
- Zoom Window
- Dynamic Zoom
- ROI Tool
- Rectangular ROI Tool
- Intensity/Color Picker Tool
- Annotation Text
- Annotation Arrow
- Measure Distance
- Measure Angle (Vertex: 1st point)
- Measure Angle (Vertex: 2nd point)
- Measure Cobb Angle
- Polyline
- Erase Annotation/Measurement
- Move Annotation/Measurement
Overview
Sante DICOM Viewer Lite is a fully functional, feature-rich, free 2D/3D DICOM viewer.
|
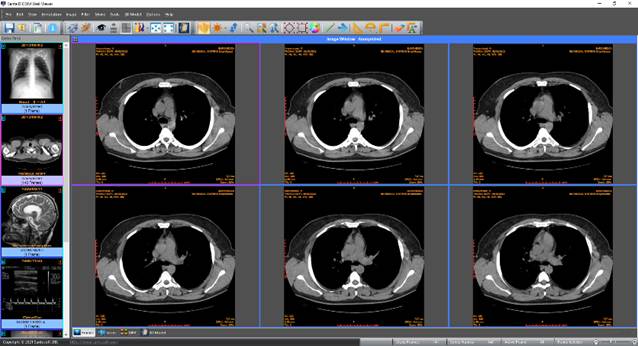
Frame View – 6 Tiles |
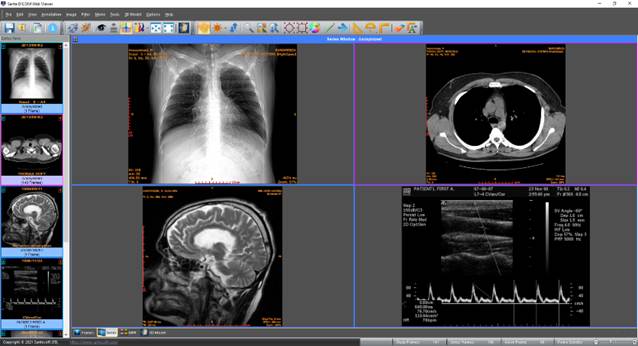
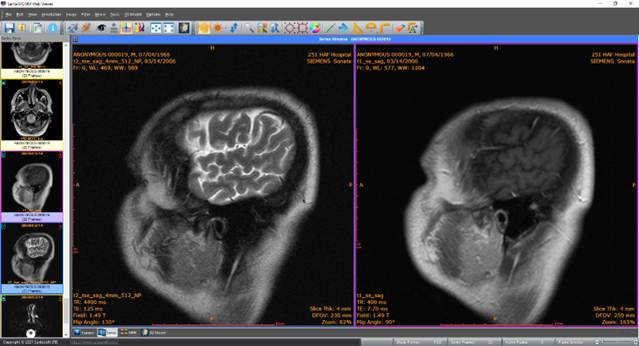
Series View – 4 Tiles |
|
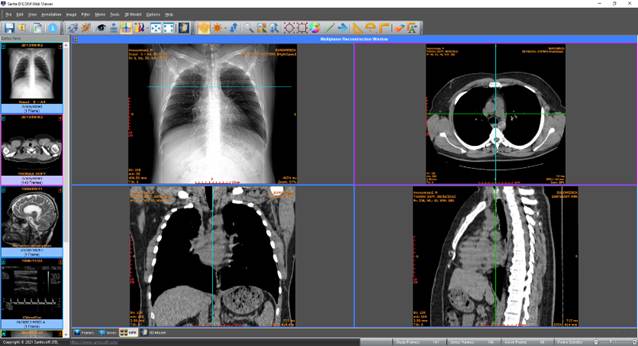
MPR View |
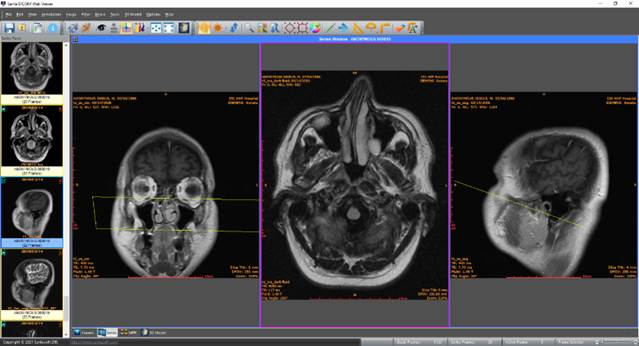
Scout lines – Localizer |
|
Series Comparison |
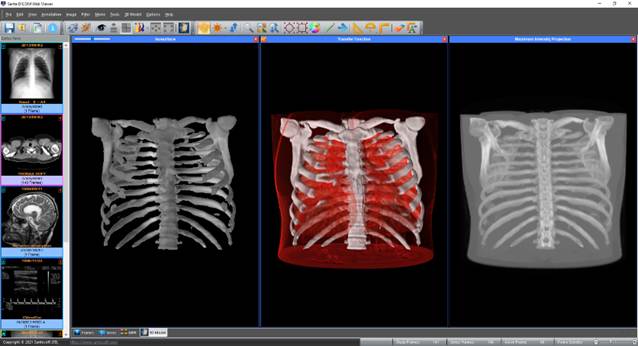
Built-in 3D Viewer |
|
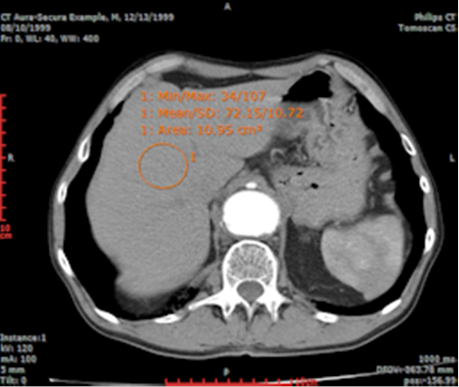
ROI Statistics |
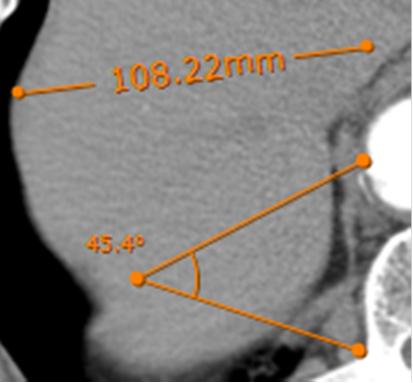
Distance and Angle Measurements |
User Interface
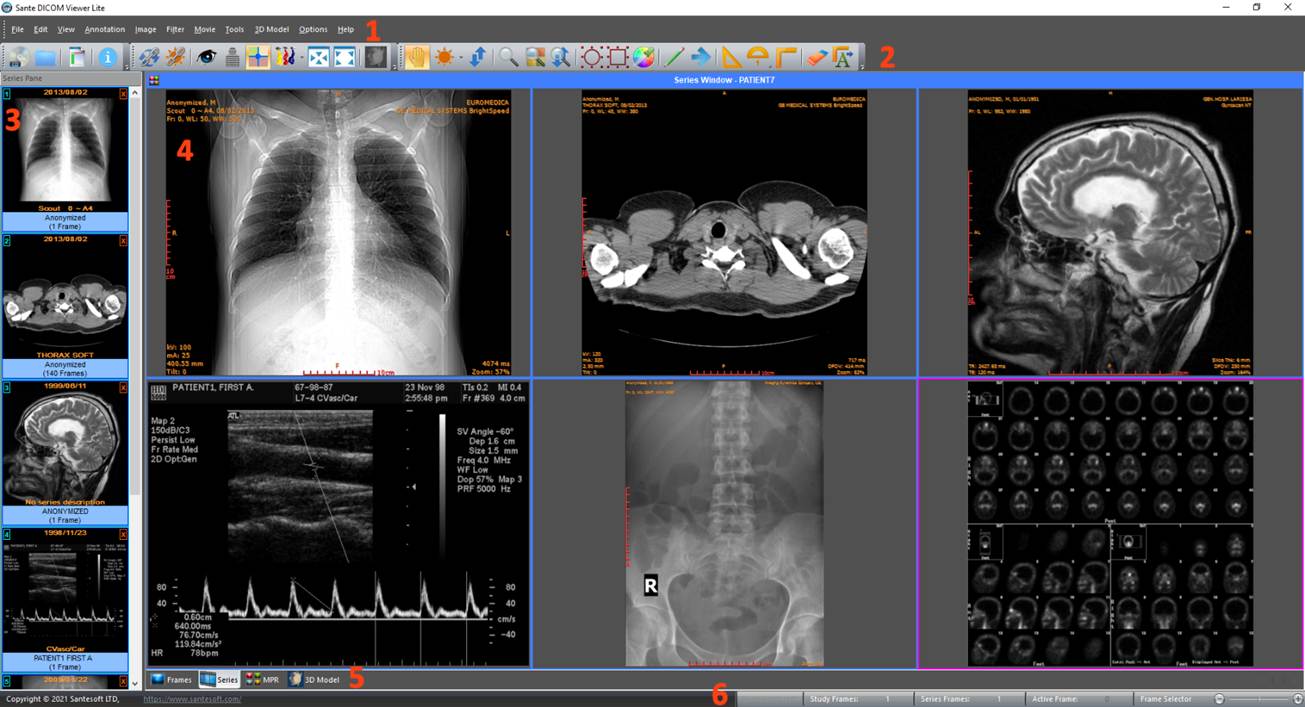
The program works with DICOM series.
If the user opens a single DICOM file, the program automatically creates a DICOM series containing that file in memory and works with it as a single-file series. If the user opens a DICOM study, the program works with all the DICOM series of this study. The loaded DICOM series are displayed in the series pane (3) as thumbnails.
The user interface is divided into six parts:
1. The menu bar
2. The toolbars
3. The series pane
4. The main window
5. The Frames/Series/MPR Mode selection tab
6. The frame selection slider
1. Menu bar
The menu bar contains all of the program's commands.
2. Toolbars
The toolbars provide shortcut buttons for the most useful commands of the
program.
The program allows users to add and remove toolbar
buttons to suit their preferences.
3. Series Pane
This pane displays a thumbnail for each loaded series. Each thumbnail shows
the patient’s name, the series description and the number of frames of the
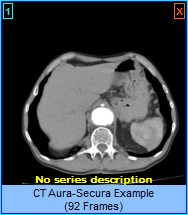
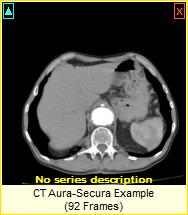
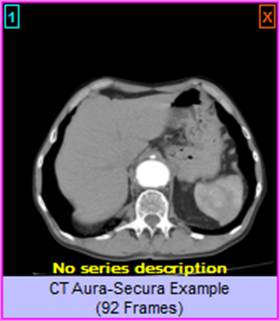
series. If a series is loaded in the main window, its thumbnail is displayed in blue. Otherwise, its thumbnail is displayed in yellow. The active series is displayed in magenta.
4. Main window
The main window is the user's primary work area. The main window displays the frames of the active series in Frame Mode, or one frame from each loaded series in Series Mode.
The user can select the main window mode from the Frames/Series/MPR/3D Model selection tab.
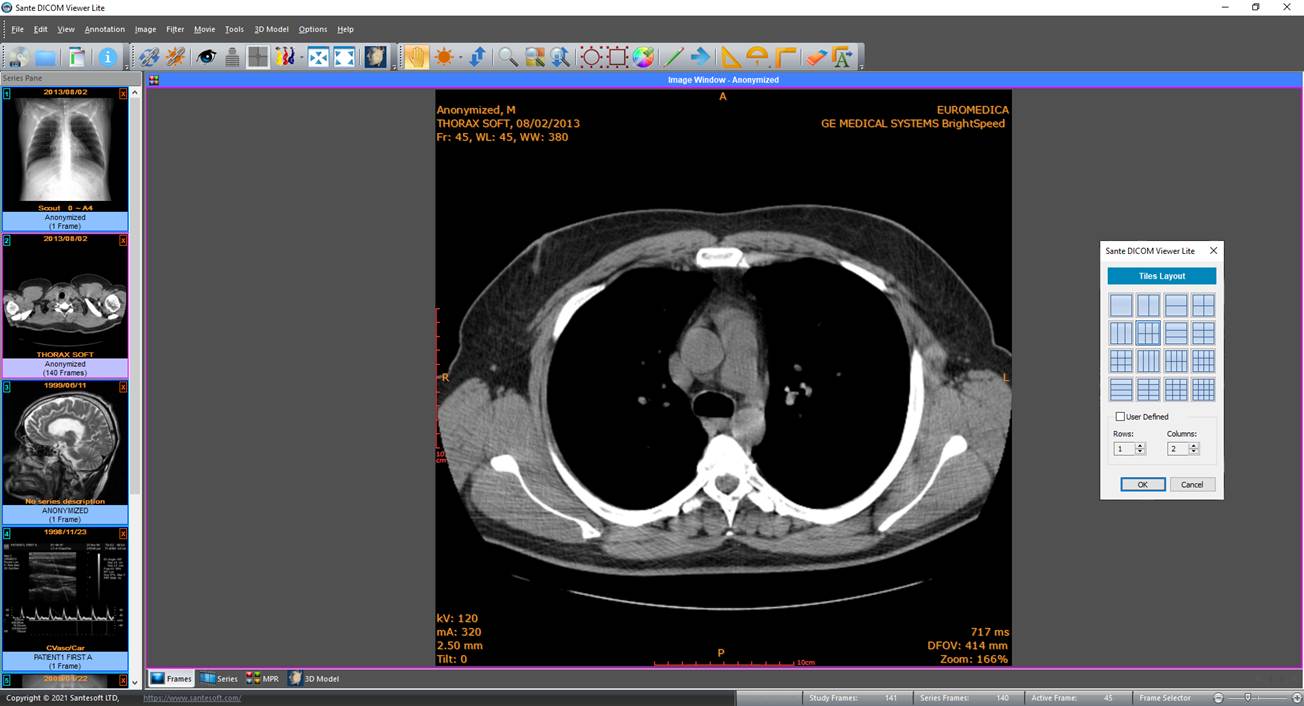
Each mode can have a different number of tiles, and the user can select the
number of tiles with the "Options Tiles
Layout"
menu command.
Tiles
Layout"
menu command.
5. Frames/Series/MPR/3D Model selection tab
If the "Frames" tab is selected, the main window displays the frames
of the active series (Frame Mode).
If the "Series" tab is selected, the main window displays all the
loaded series (Series Mode).
If the "MPR" tab is selected, the main window displays the scout
image/localizer and the axial/coronal/sagittal volumes of the series (MPR
Mode).
If the "3D Model" tab is selected, the main window displays a 3D model
of the loaded series (3D Model Mode).
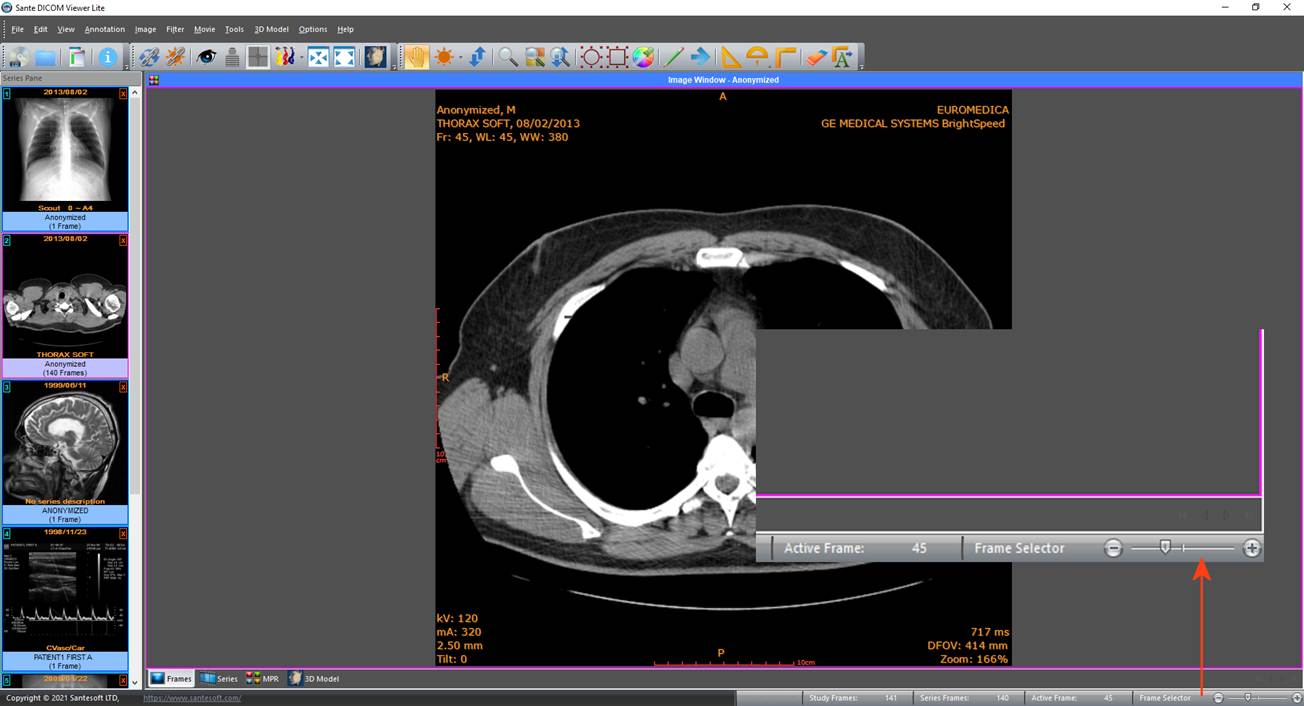
6. Frame selection slider
If the active series has many frames, this slider lets the user select the
active frame. Otherwise, it is disabled.
The modes of the Main Window (4)
The Main Window (4) is divided into tiles and has four modes:
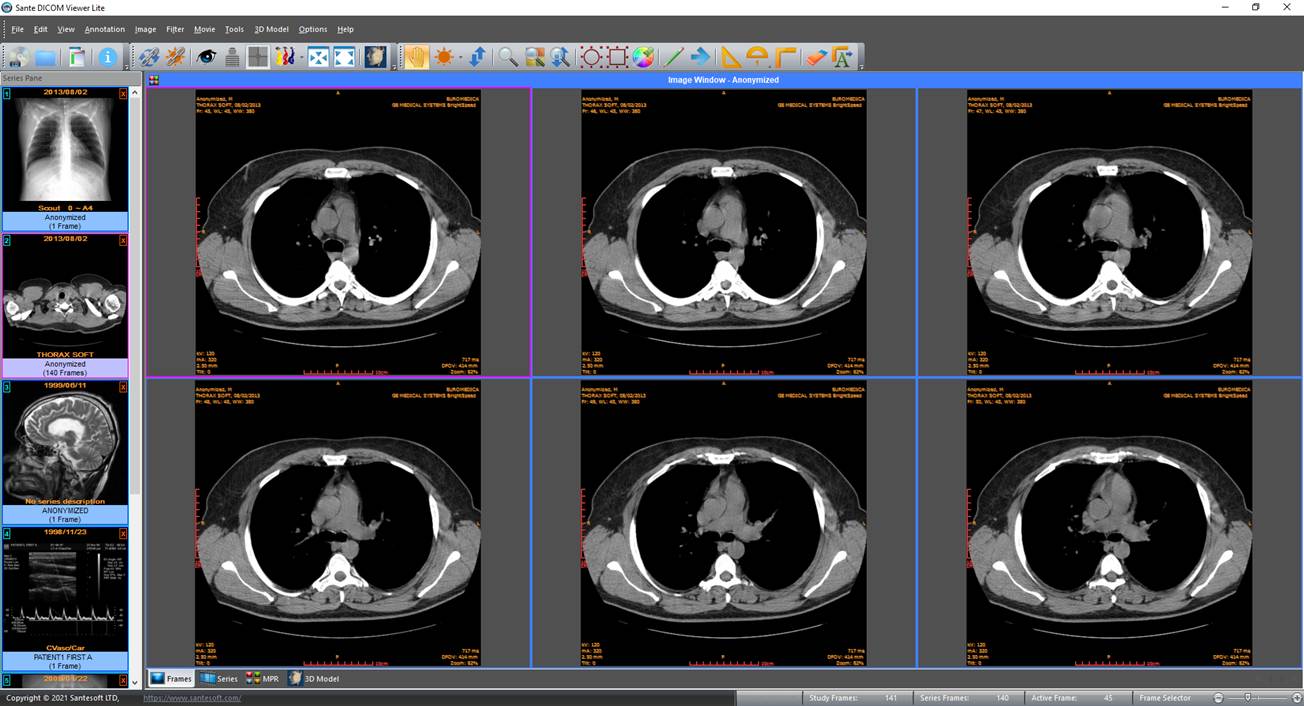
1. The "Frames Mode", which displays in its tiles the
frames of the same series (the active series).
The user can select the number of tiles with the "Options
Tiles
Layout"
menu command.
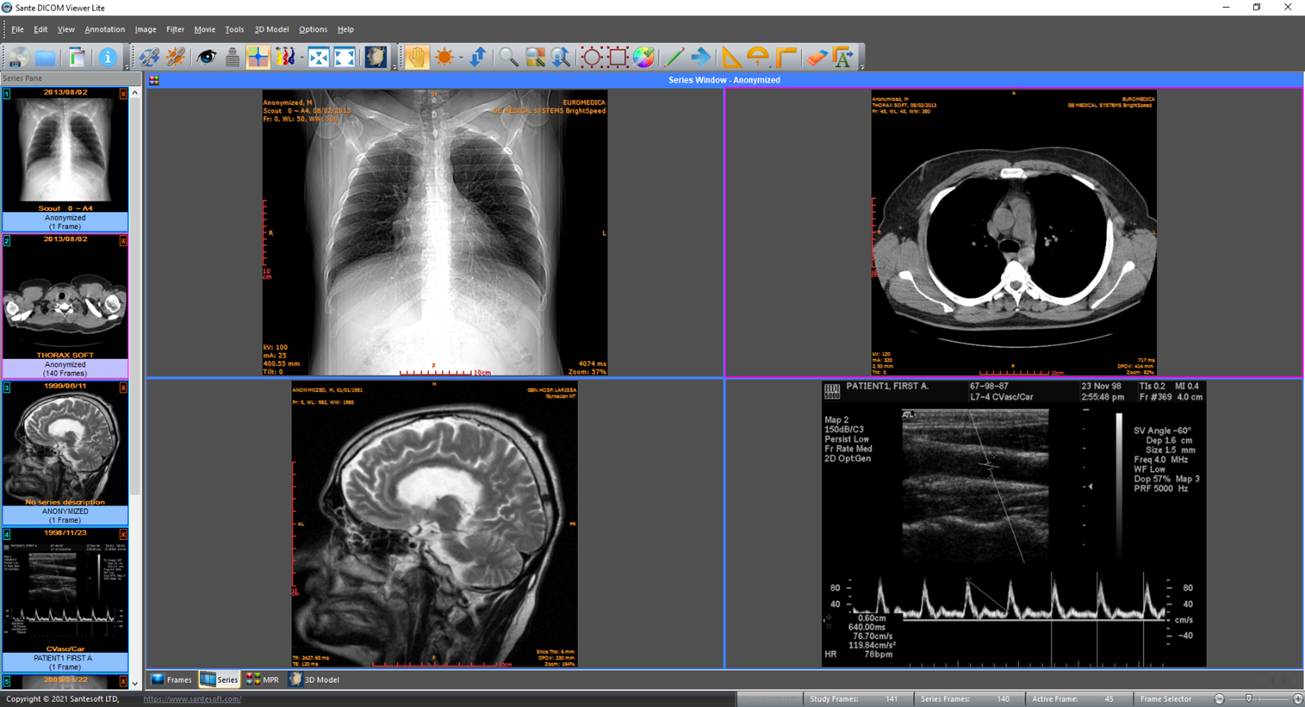
2. The "Series Mode", which displays all series loaded in the Main Window.
The user can select the number of tiles with the "Options
Tiles
Layout"
menu command.
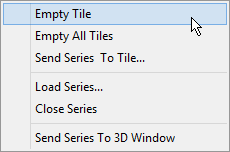
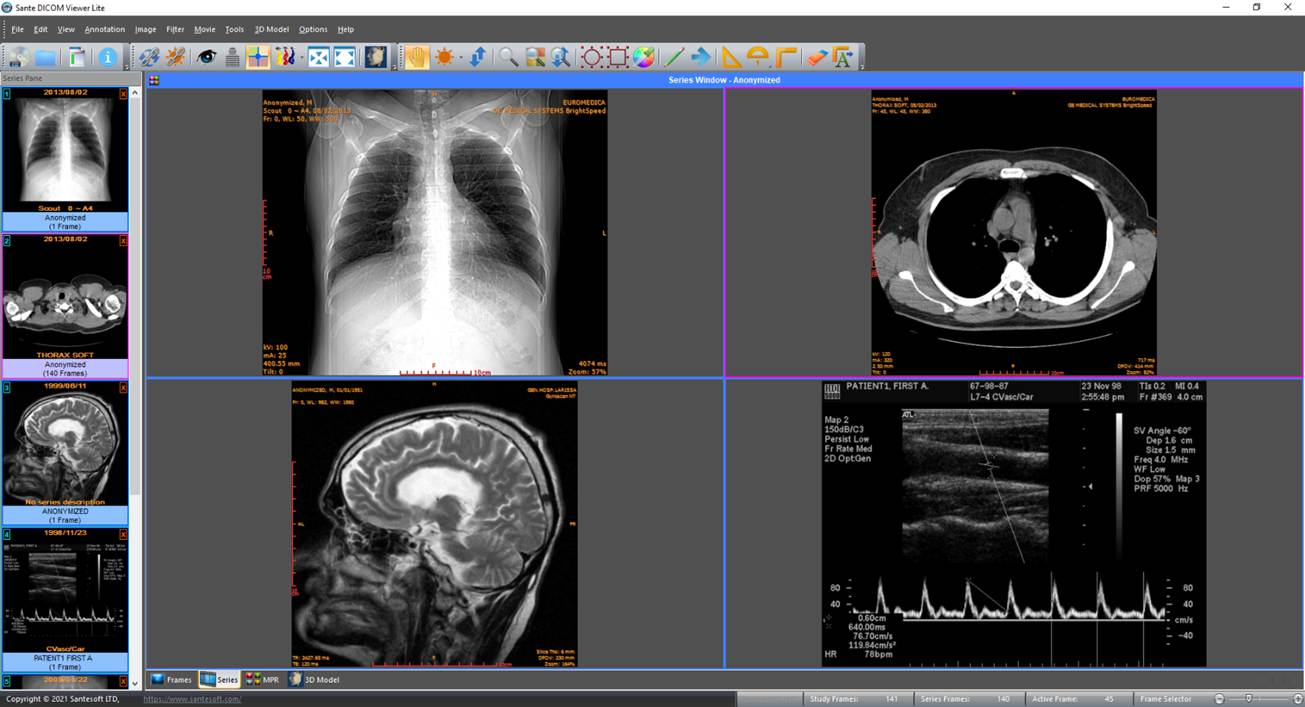
In Series Mode, the active series is displayed with a red rectangle around its tile (4). The user can select the active series by clicking its tile in the "Series Mode", or by single-clicking its thumbnail in the series pane. If a series is loaded in the main window, in the upper-left corner of its thumbnail is displayed the number of its "Series Mode" tile. If the user presses the right mouse button in a "Series Mode" tile, a pop-up menu appears and lets the user empty the tile, empty all tiles, change the series tile, load another series into the tile, or close the series currently loaded in it. This menu is not available in the "Frames Mode".
3. The "MPR Mode", which displays the scout
image/localizer, the axial volume of the series and the volumes of the coronal
and sagittal reconstructions of the series.
4. The "3D Model Mode", which displays a 3D model of the
loaded series.
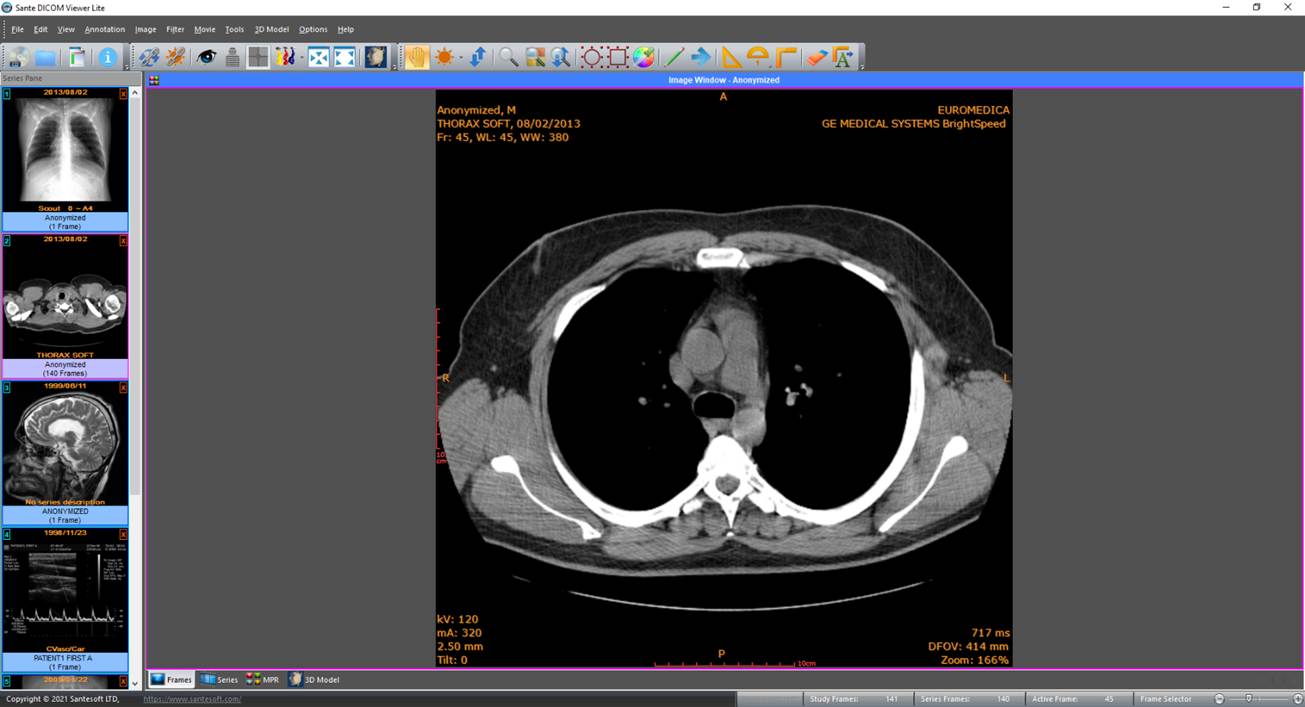
The main window in the frame mode (one tile)
The main window in frame mode (six tiles): Displays six frames of the active series. The number of the tiles is selectable by the user.
The main window in the series mode (four tiles): Displays four different
series. The user can select the number of tiles. The active series
has a red rectangle around its tile.
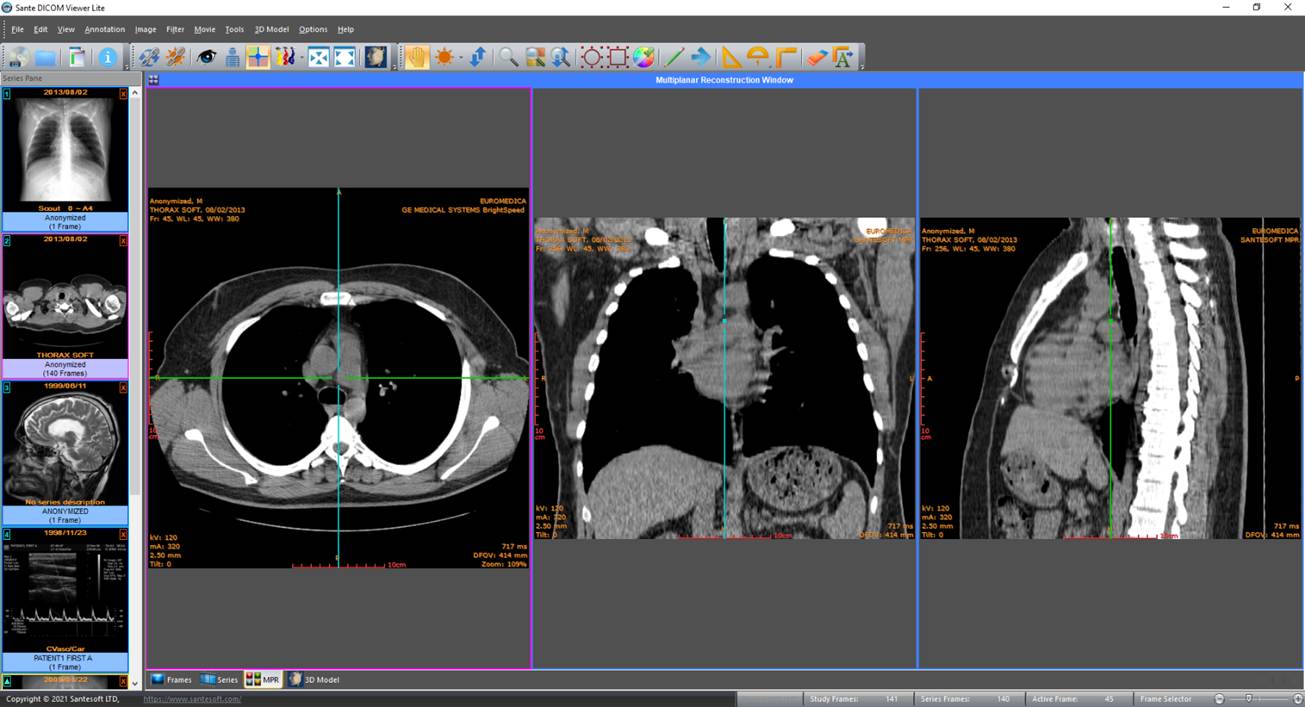
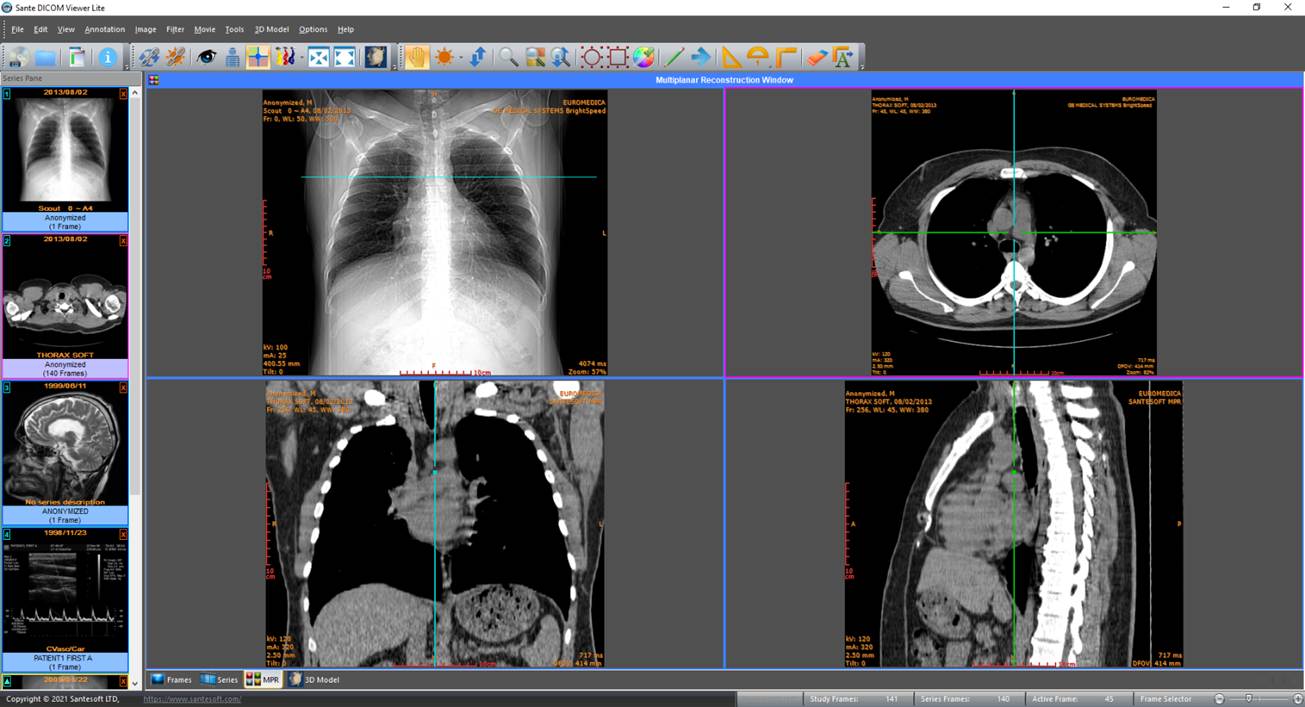
The main window in the MPR mode
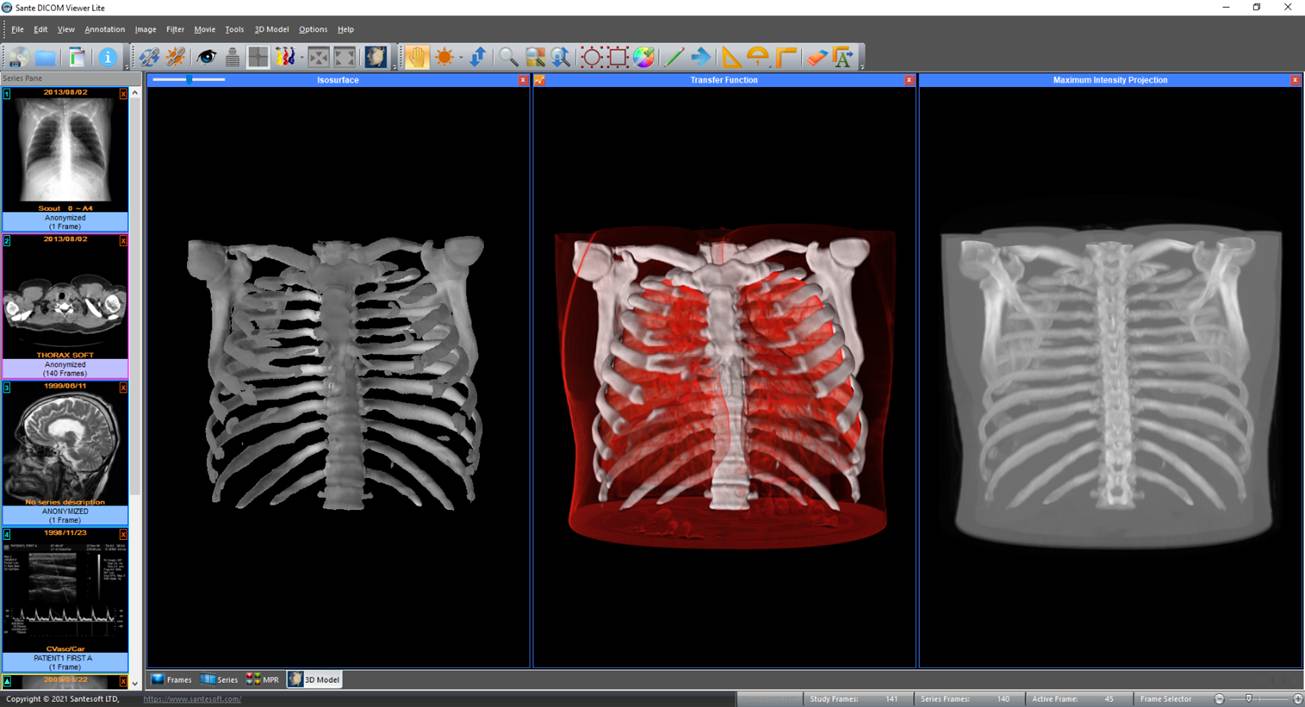
The main window in the 3D Model mode: Displays a 3D model of the current series.
Customize the Toolbars
The program allows users to add and remove toolbar
buttons to suit their preferences.
Any toolbar can be quickly customized with the "Add or Remove
Buttons" submenu available from the chevron button when it is docked or
with a special button in the toolbar caption when it is floating.
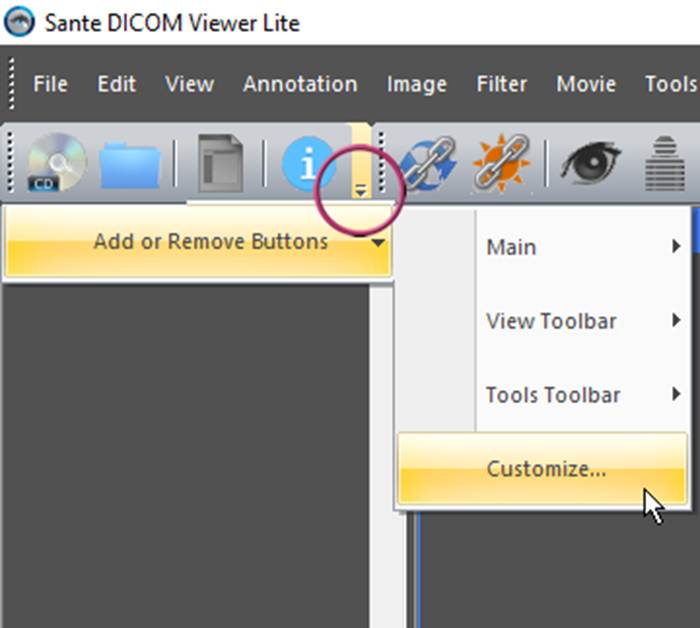
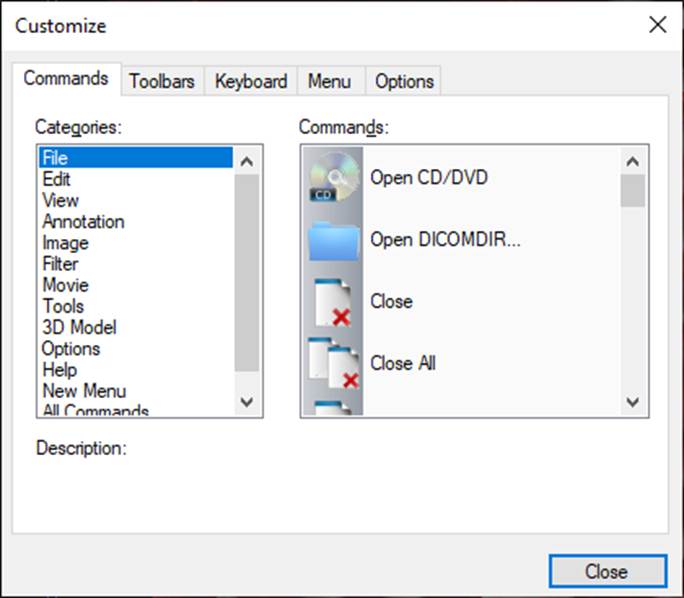
Selecting the "Customize" menu item opens a dialog box
and allows the user to drag and drop buttons from the dialog box to any
toolbar.
It also allows the user to drag buttons out of a toolbar to remove
them.
Load a series to the main window
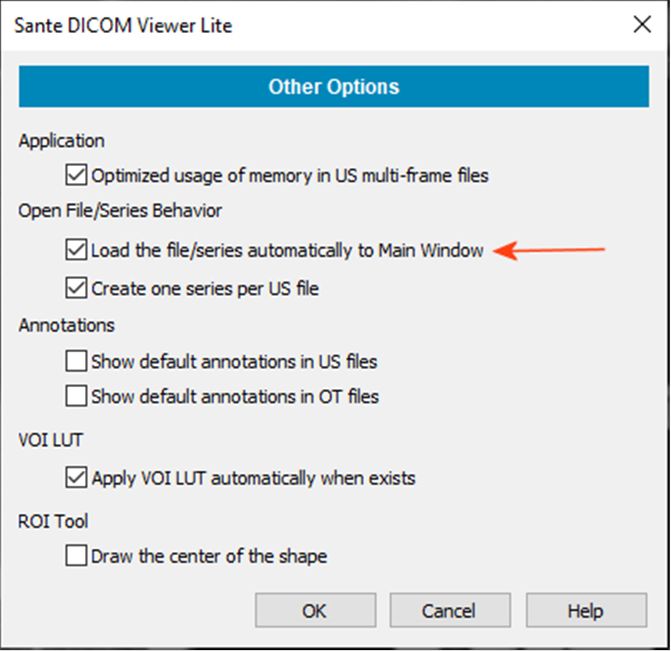
The program automatically loads all opened series into the
main window. If you wish to change this behavior, select the menu command "Options
Other
Options"
and uncheck the checkbox
"Load the file/series
automatically to Main Window"
To load a series into the Main Window, use one of the following methods:
1. Double-click the series thumbnail in the Series Pane (3).
2. Click the green rectangle in the upper-left corner of the series
thumbnail in the Series Pane (3).
3. Use the "drag-and-drop" operation in the Frame Mode,
Series Mode or MPR Mode.
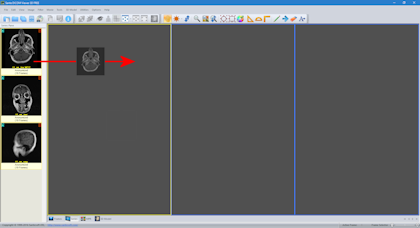
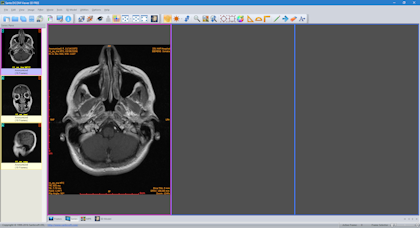
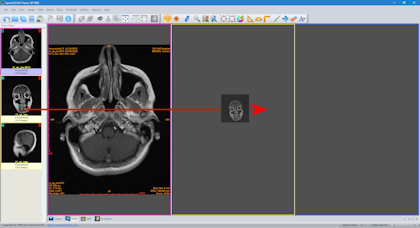
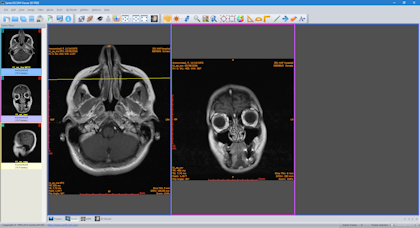
When using drag and drop in Series Mode, you can select the tile
for every series, so you can arrange the series in the desired order.
If the destination tile already contains a series, the program replaces the old
series with the new one.
4. In the Series Mode, right-click the
desired tile.
A pop-up menu appears and allows the user to load a series into the tile.
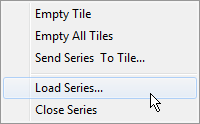
This menu is not available in the other modes.
Set the Active Series
1. Click the series thumbnail of a loaded series in
the Series Pane (3).
2. In the Series Mode, left-click the
desired series.
The series becomes active and it has a red rectangle around its tile.
Unload a series from the main window
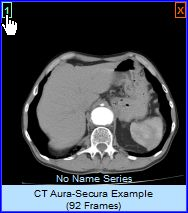
1. In the upper-left corner of the loaded series
thumbnail in the Series Pane (3) a number is displayed.
This number indicates the tile of the Main Window in the Series Mode in
which this series is loaded.
Click this number to unload the series from the Main Window. The series remains in memory and its thumbnail becomes yellow.
2. In the Series Mode, right-click the tile
of the desired series.
A pop-up menu appears and allows the user to unload the series and empty the
tile.
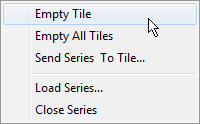
This menu is not available in the other modes.
Close a Series
1. To close the active series select the menu command
"FileClose"
2. To close all the series, select the menu command "File
Close
All"
3. To close a specific series, press the red x button in the
upper-right corner of its thumbnail in the series pane (3).
4. In the Series Mode, right-click the tile
of the desired series.
A pop-up menu appears and allows the user to close the series, release its memory
and empty the tile.
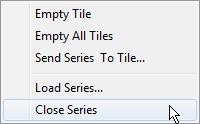
This menu is not available in the other modes.
Series Mode
The "Series Mode" can display one or more
series.
It displays the cross-reference lines between series when the series belong
to the same study and the same patient.
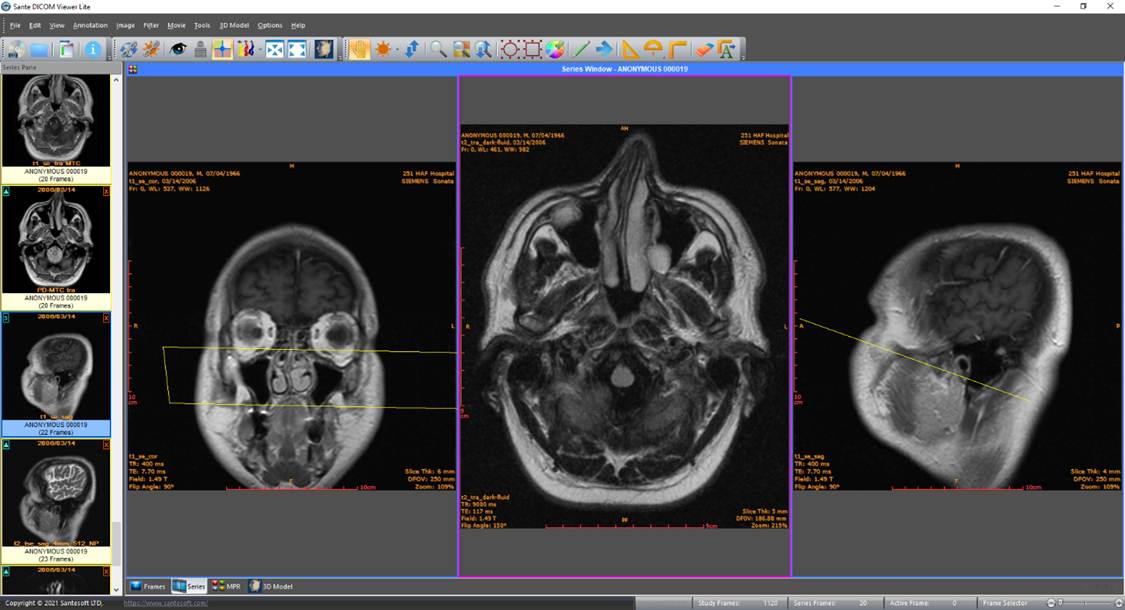
This mode can be used to compare series. The program provides all the
necessary tools for this purpose:
1. Use the menu command "View
Synchronized
Series Frames"
( )
to force the program to display the corresponding frame in all series (the series
must have the same orientation).
)
to force the program to display the corresponding frame in all series (the series
must have the same orientation).
2. Use the menu command "View
Synchronized
Series Level-Window"
( )
to force the program to display images from all series using the same
level-window values.
)
to force the program to display images from all series using the same
level-window values.
3. Use the menu command "View
Synchronized
Field of View"
( )
to force the program to display images using the same field of view.
)
to force the program to display images using the same field of view.
MPR Mode
The MPR window can display three or four tiles. The user can switch between the three-tile and four-tile layouts using the button in the upper-left corner of the window.
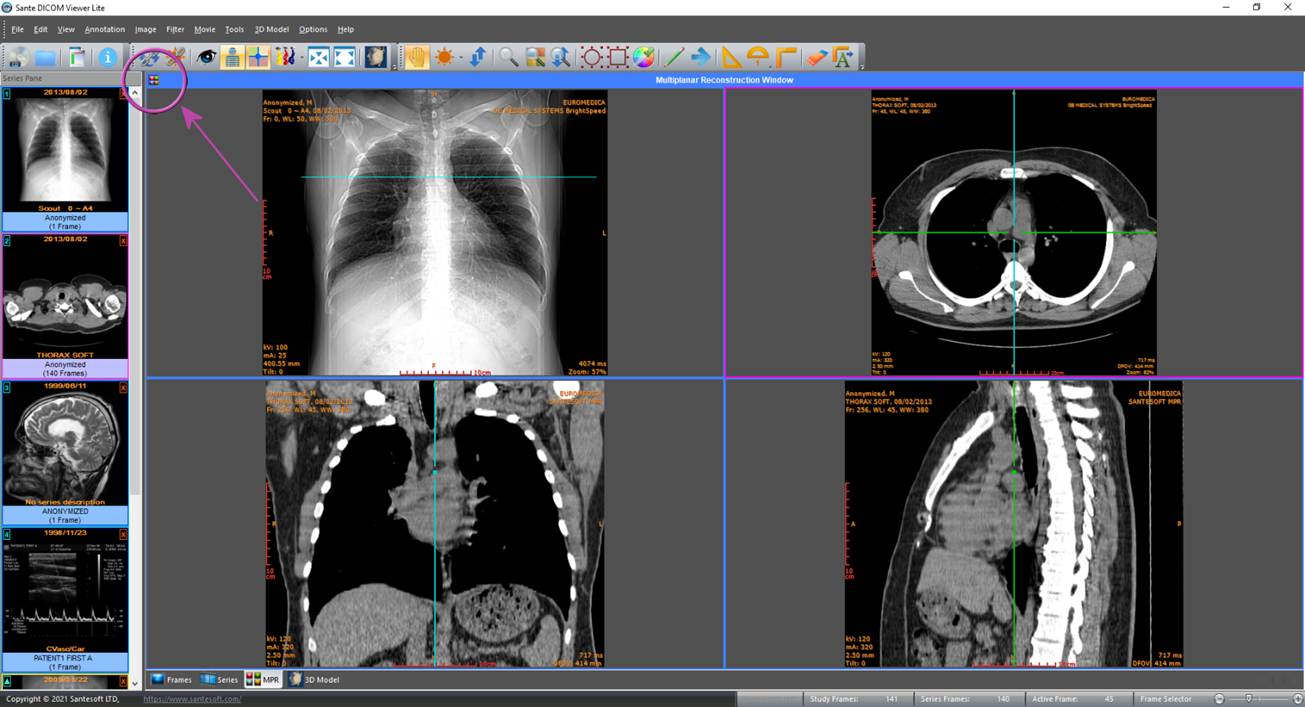
In the three tiles, the
"MPR
Mode"
displays the axial series together with its coronal and sagittal
reconstructions. In the four tiles, the
"MPR Mode" displays the scout image/localizer, the axial series, and its coronal and sagittal reconstructions.
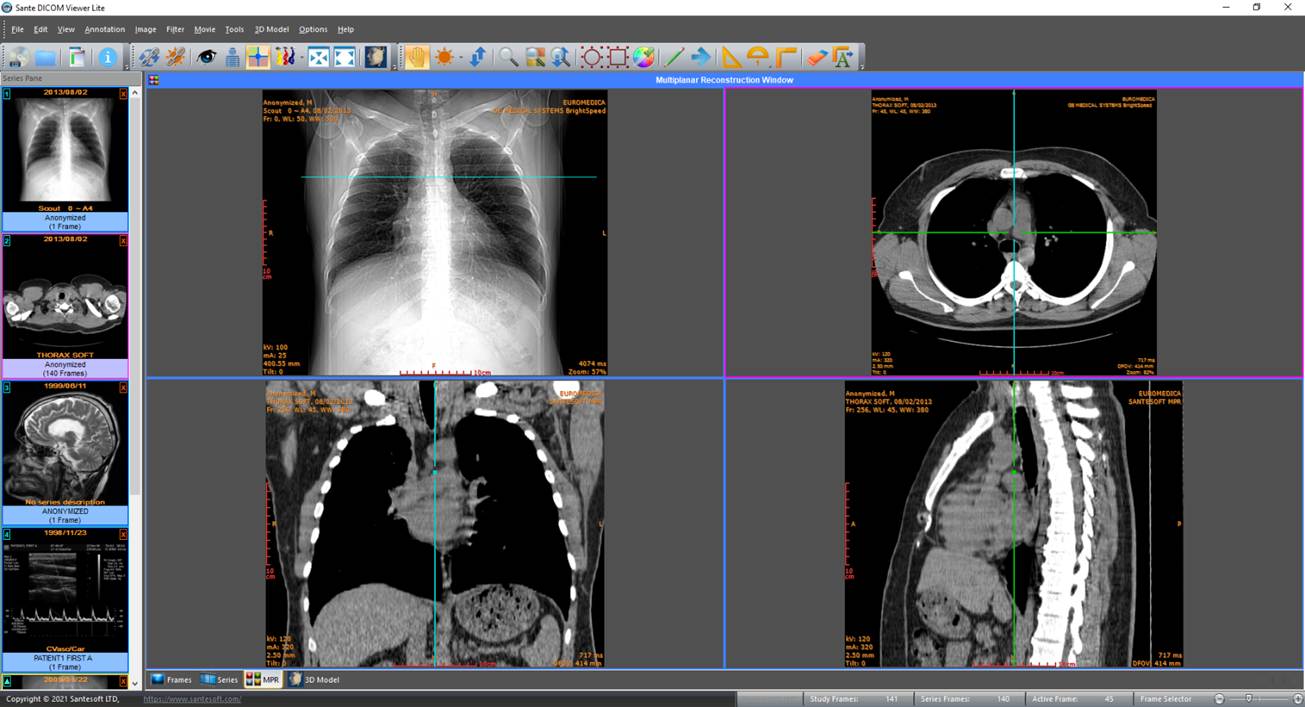
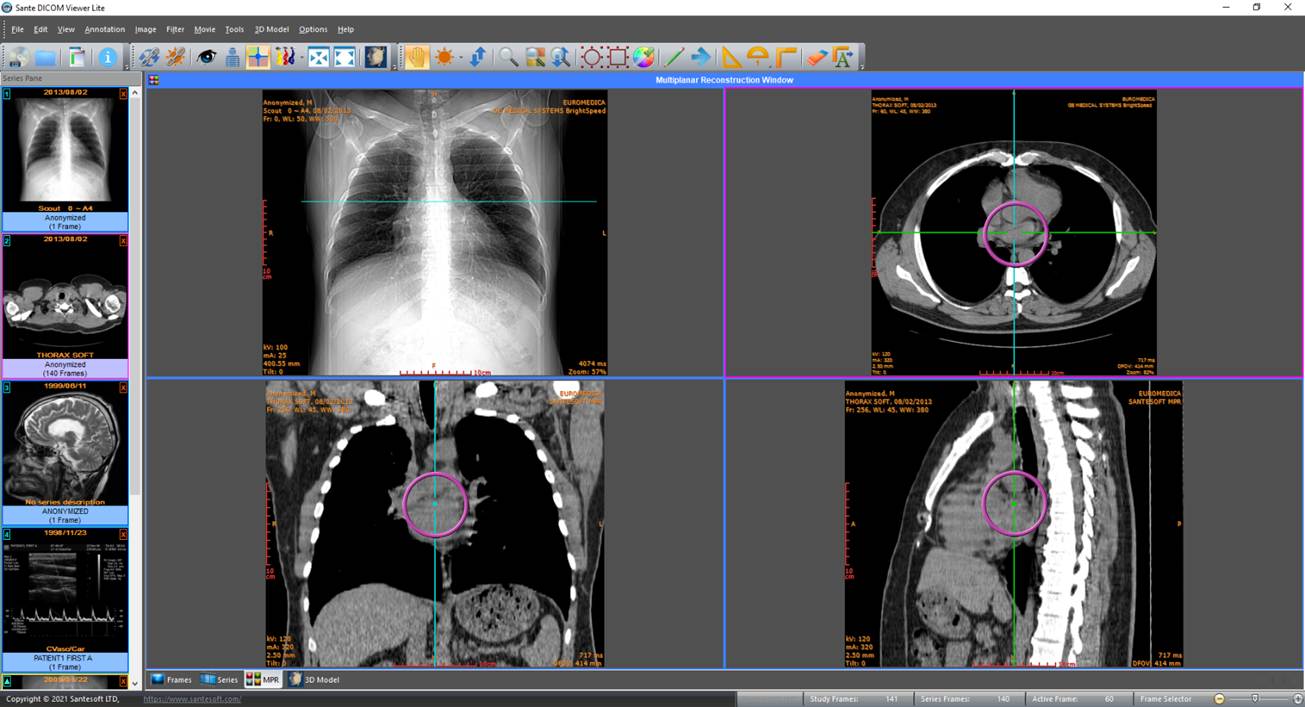
The user can move the cross-reference lines in the axial,
coronal and sagittal frames using the points indicated in the image
below:
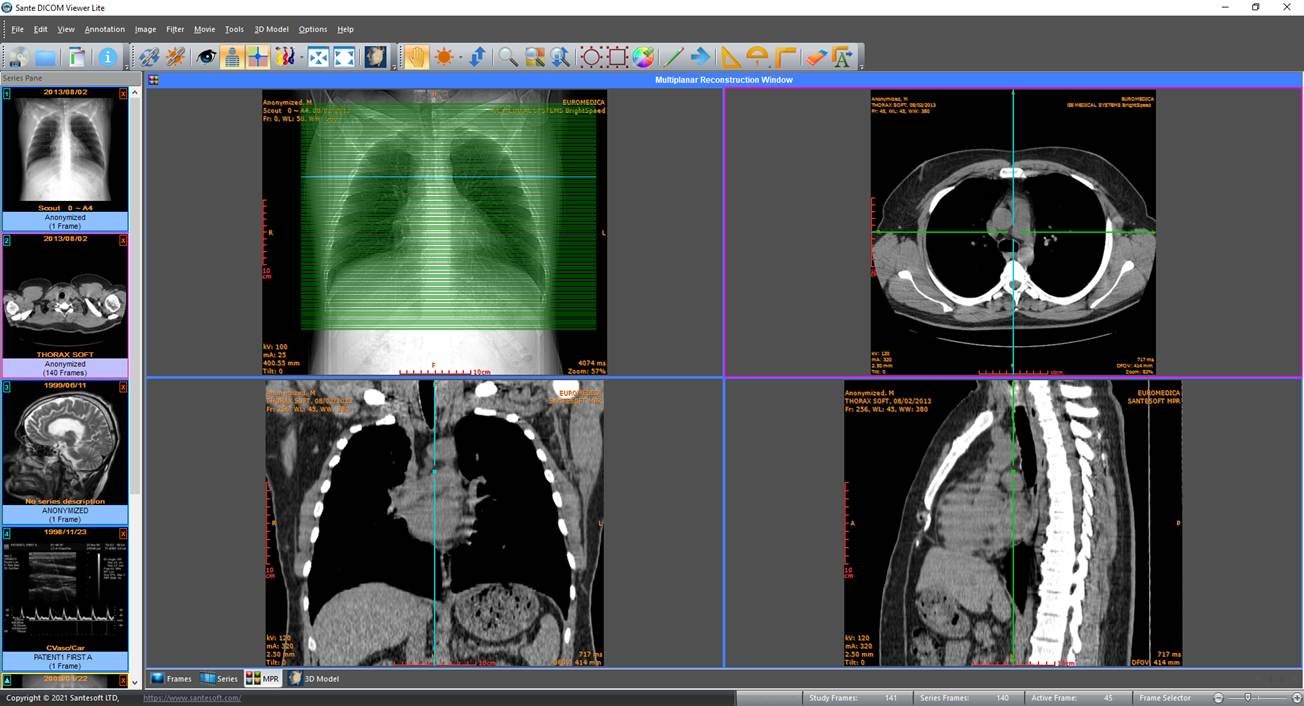
The program displays the cross-reference lines of all axial frames in the scout image/localizer if the menu command "View
All
Localizer Lines"
is selected.
3D Model Mode
The program can create a 3D model from the 2D image data of the files of a DICOM series.
The user can use the menu commands
"3D ModelCreate 3D Model"
"3D Model
Create
3D Model By Kept Selections"
"3D Model
Create
3D Model By Histogram"
to create a 3D model of the current series.
The program offers three different 3D rendering techniques: The Isosurface technique, the Maximum Intensity Projection (MIP) technique, and the Transfer Function technique.
The program can display the 3D model of one, two, or all three techniques simultaneously on the screen.
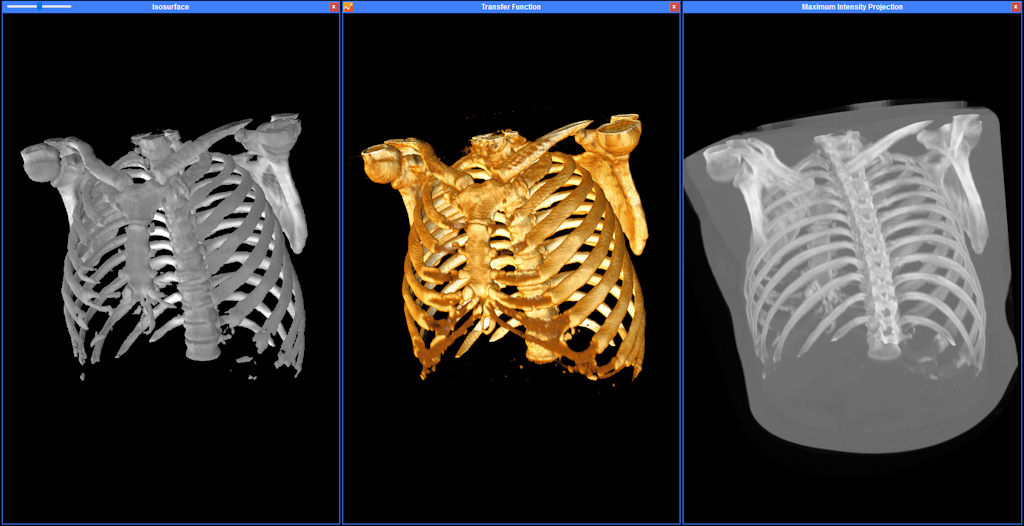
The Isosurface technique
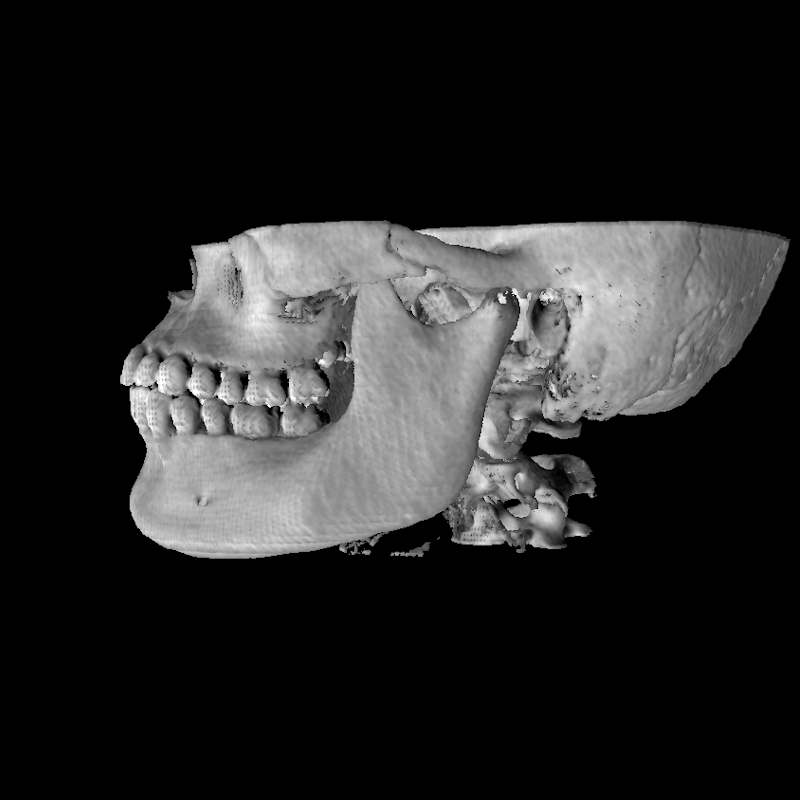
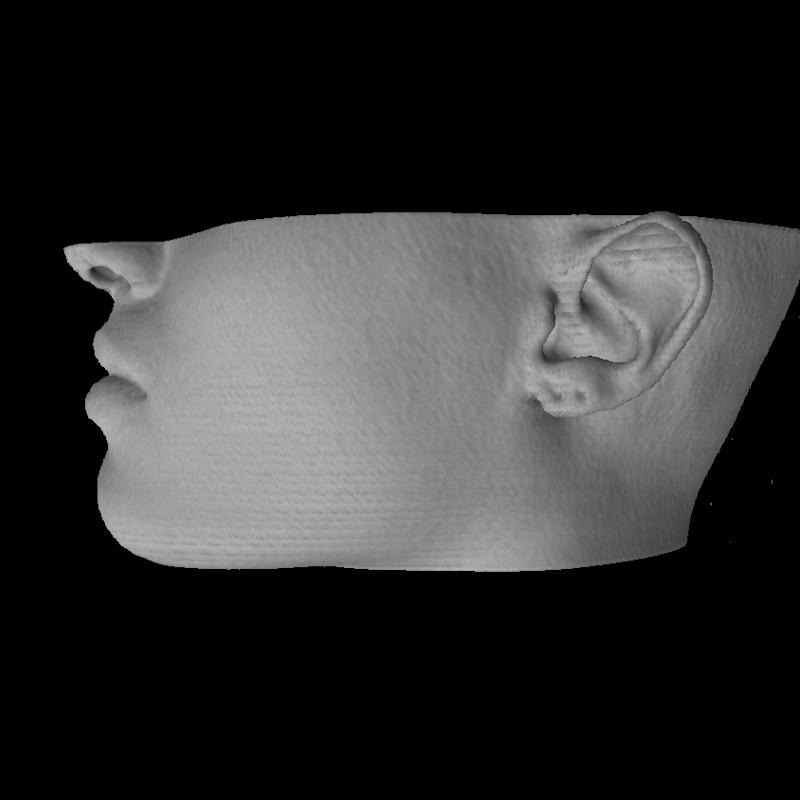
The program uses the marching cubes algorithm to construct the Isosurface model and allows the user to select the isovalue to create a model from different parts of the human body.
A model with a middle isovalue and a low isovalue:
In the upper-left corner of the Isosurface window there is a control that
allows the user to select the isovalue.
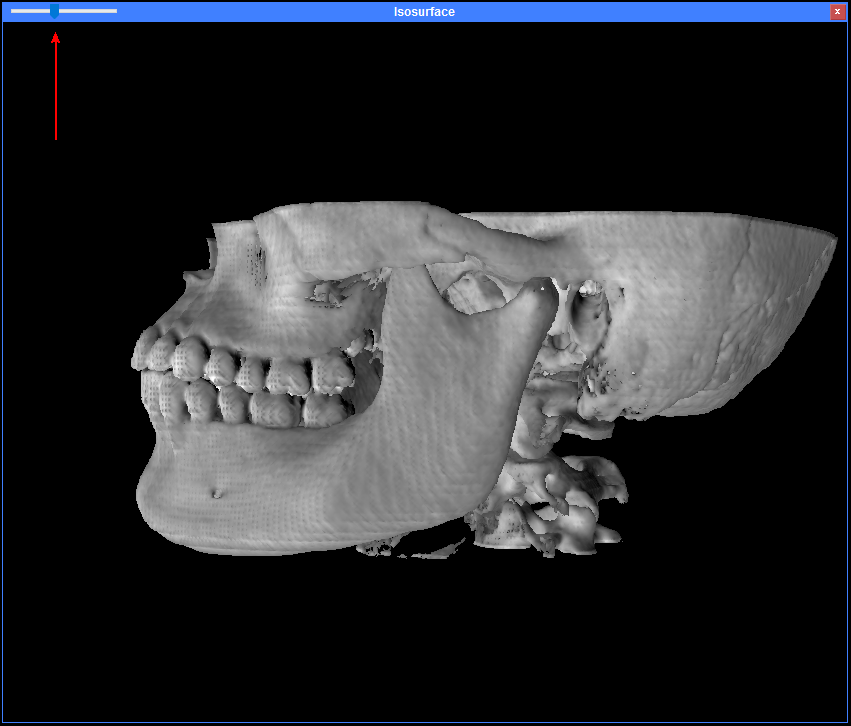
The user can enable this technique with the menu command "3D Model
Show
Isosurface Model"
The Maximum Intensity Projection (MIP) technique
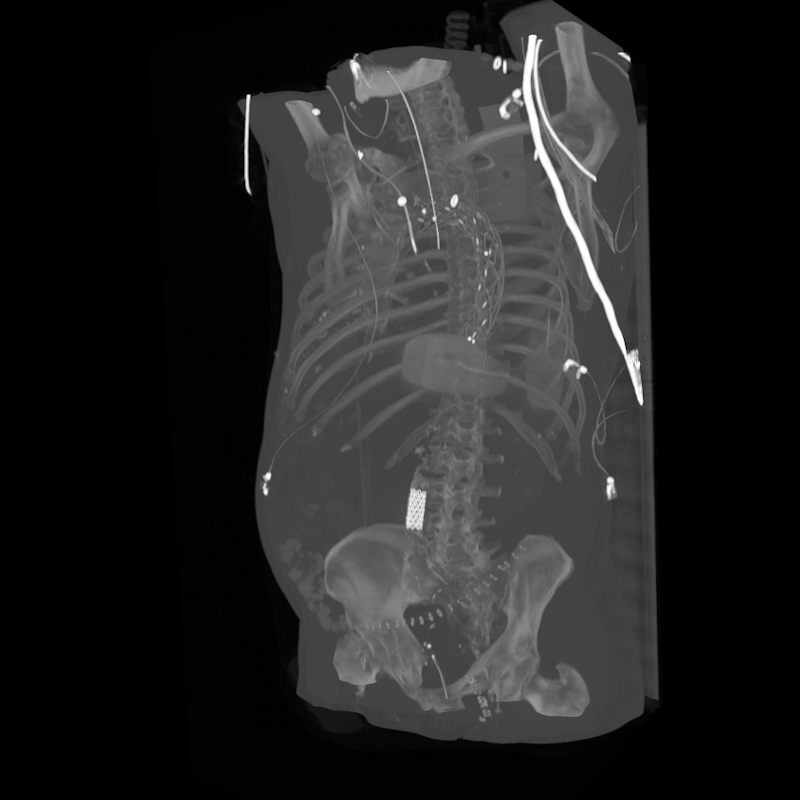
In this technique the program projects onto the visualization plane the voxels with maximum intensity that lie along parallel rays traced from the viewpoint to the plane of projection.
A model with the Maximum Intensity Projection (MIP) technique:
The user can enable this technique with the menu command "3D Model
Show
MIP Model"
.
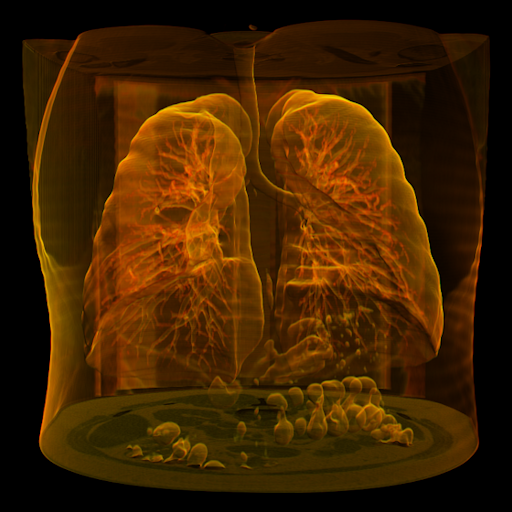
The Transfer Function technique
The Transfer Function technique is a volume ray casting and rendering technique that assigns a different color and a different opacity/transparency value across different ranges of intensity values. This is done with a histogram-based function, the "transfer function". The transfer function consists of a number of control points, and each of which corresponds to an intensity value and has an RGB color and an opacity/transparency value. The intensity value of a control point is displayed with its color and opacity/transparency value, and the intensity values between two control points are displayed with the interpolated colors and the interpolated opacity/transparency values of the two control points. Using the transfer function, the different parts of the human body are displayed with a different color and a different opacity/transparency value.
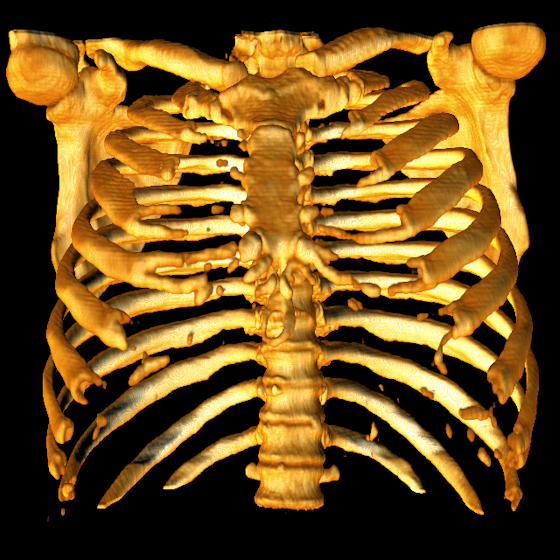
The user can enable this technique with the menu command "3D Model
Show
Transfer Function Model"
The Transfer Function Pane
The user can design the transfer
function using the Transfer Function Pane, which allows the user to
insert a control point at a specific intensity value, and to define the color
and the opacity/transparency value of the control point. The Transfer Function
Pane is accessible via the menu command "View
Panes
and Status Bar
Transfer
Function Pane"
.
The image histogram is displayed in the background of the Transfer Function Pane. The transfer function creates a palette of colors that is assigned to
the intensity values and it is displayed at the bottom of the graph.
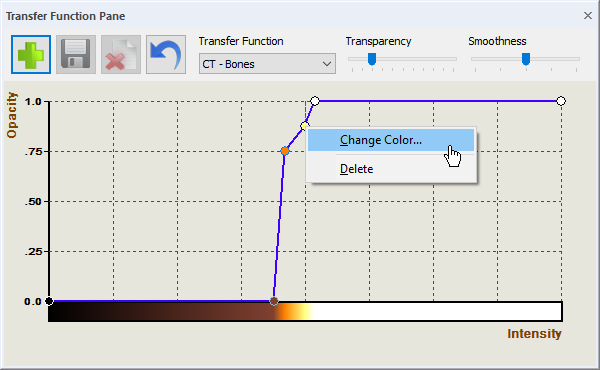
Insert a control point:
Hold down the Ctrl key and press the left mouse button on the desired point of the histogram.
Change the position of a control point (intensity value):
Press the left mouse button on the desired control
point and move it left (to a lower intensity value) or right (to a higher intensity value).
Change the position of a control point (opacity value):
Press the left mouse button on the desired control
point and move it down (to a lower opacity value) or up (to a higher opacity value).
Change the color of a control point:
Press the right mouse button on a control point and select the menu item "Change Color".
Delete a control point:
Press the right mouse button on a control point and select the menu item "Delete".
Move a portion of the function:
Hold down the Shift key, press the left
mouse button on the desired control point and move it left and right.
The changes are immediately displayed on the 3D model.
Transfer Function Pane controls
The program offers a number of predefined transfer functions as well as user functions that are accessible via the combo box "Transfer Function"
Copy button

Use this button to make a copy of the current transfer function. Users can create as many transfer functions as needed.
Save button

Use this button to save the current transfer function. The user cannot save the predefined transfer functions, but can make a copy of a predefined transfer function, modify it and save it with a different name.
Delete button

Use this button to delete the current transfer function. The user cannot delete the predefined transfer functions.
Invert button

Use this button to invert the colors of the current transfer function. Hold down the Ctrl key and press this button in order to invert the entire transfer function.
"Transfer Function" combo box
Allows the user to select one of the predefined or user-defined transfer functions.
"Transparency" slider control
Adjusts the transparency of the model. The "Transparency" is part of the current transfer function and is saved with it.
|
Low transparency value |
High transparency value |
|
|
|
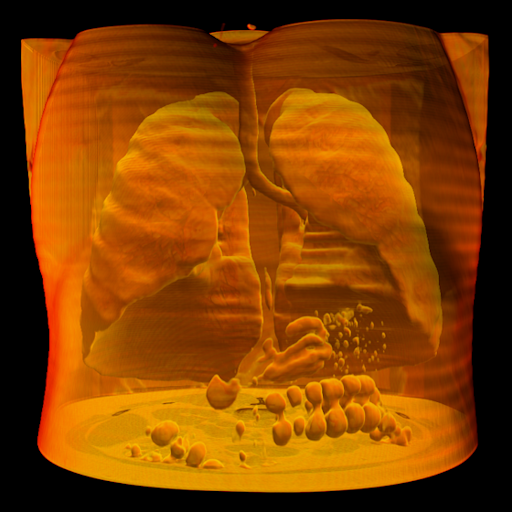
"Smoothness" slider control
Adjusts the smoothness of the model. The "Smoothness" is a part of
the current transfer function and saved with it. A low smoothness value creates
a sharp model and a high smoothness value creates a smooth model.
|
Low smoothness value |
High smoothness value |
|
|
|


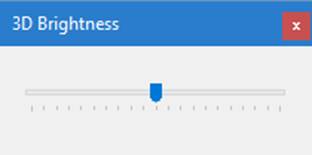
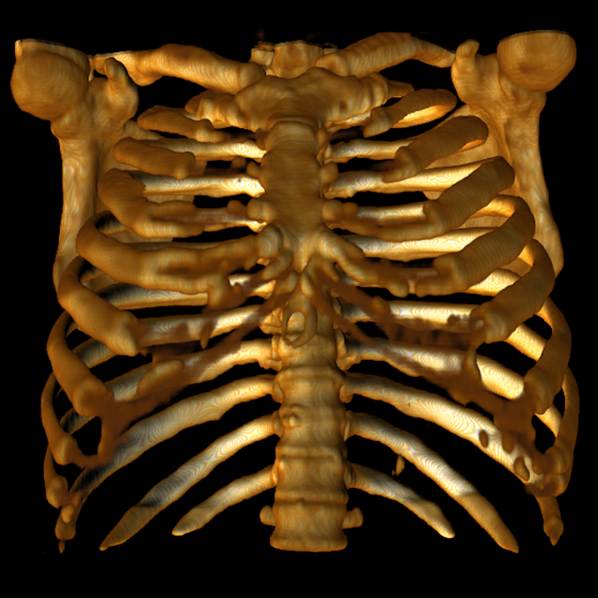
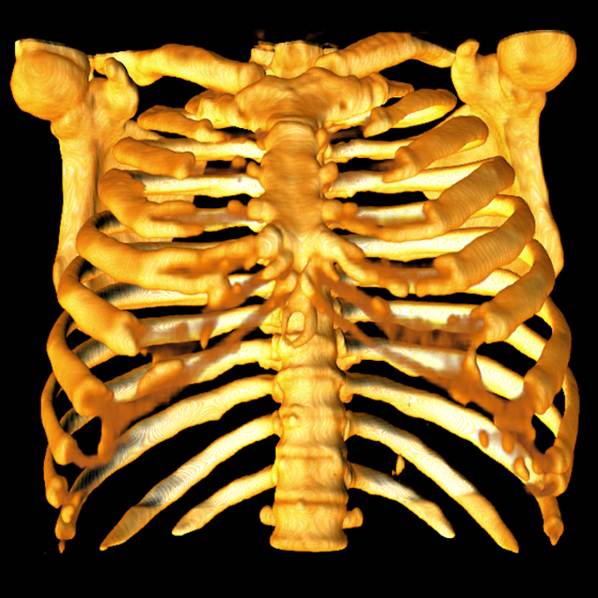
The user can use the menu command "3D ModelBrightness"
to change the brightness of the model
|
Low brightness value |
High brightness value |
|
|
|
Compare images of different series
|
Open the series.
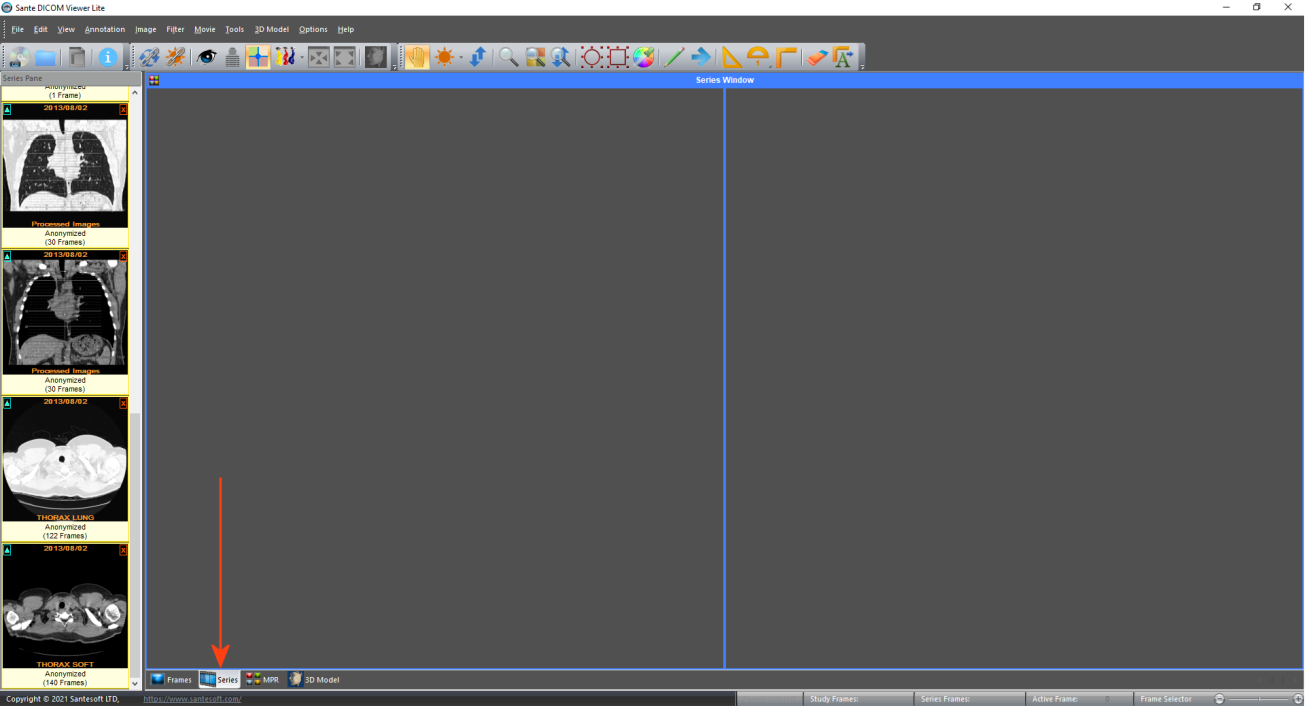
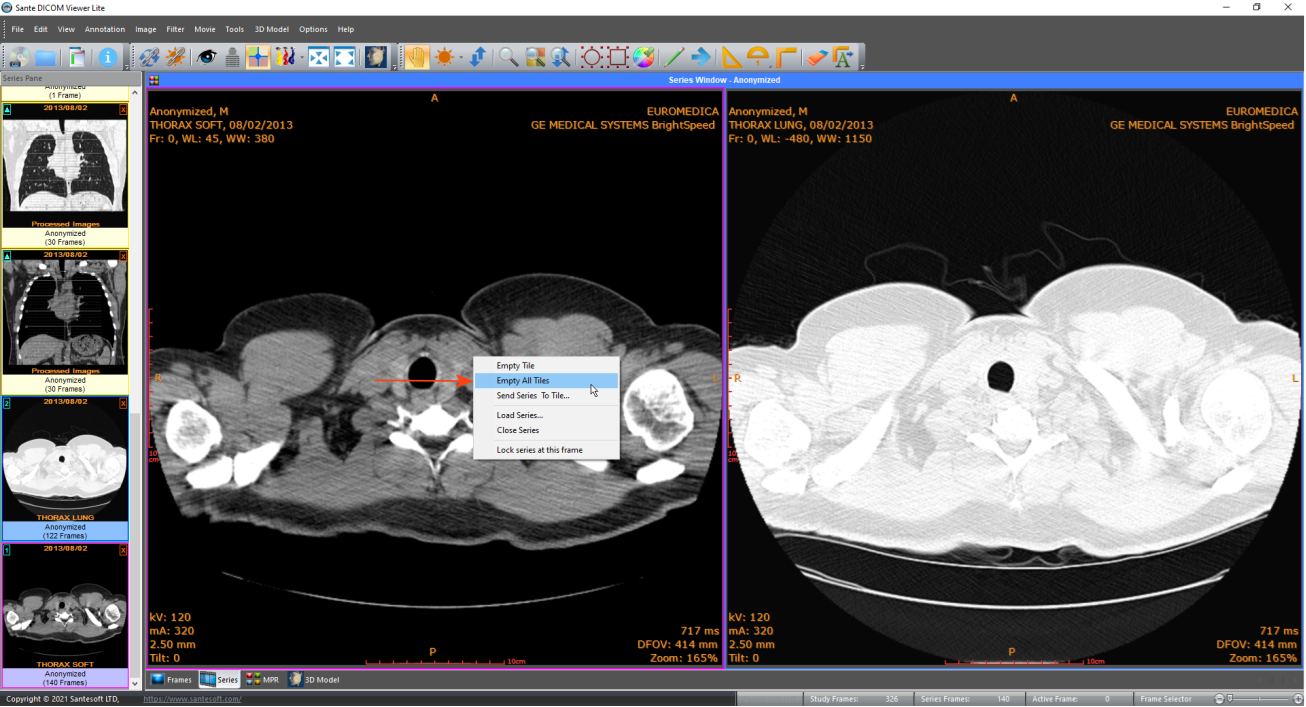
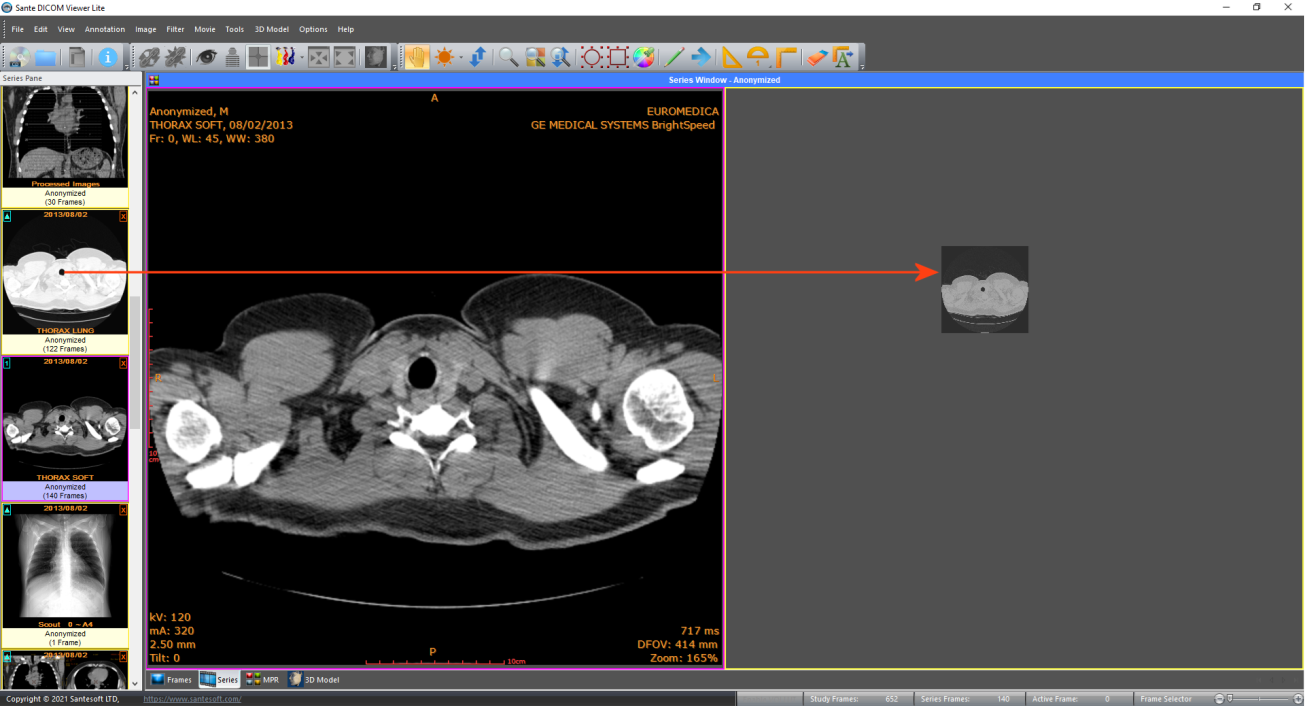
From the Tab control select the Series View. If series are already loaded in this window, right-click and select the "Empty All Tiles" command.
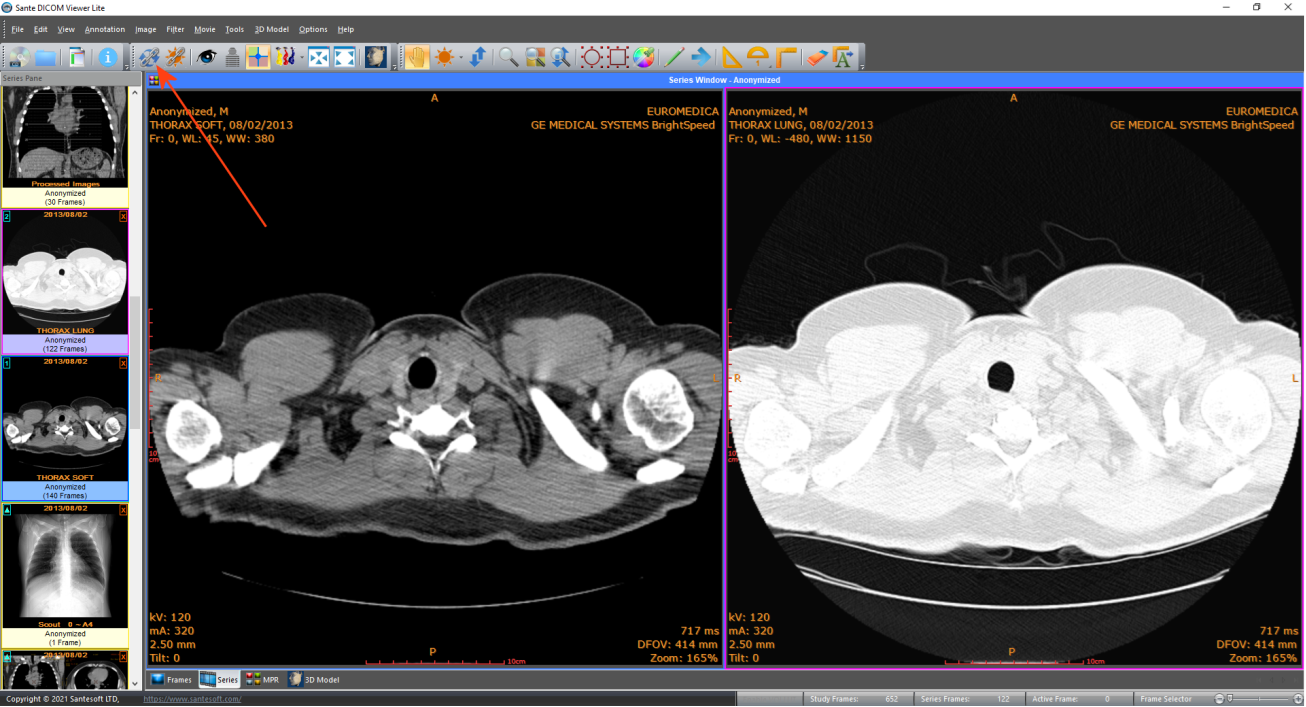
Select the menu command "Options
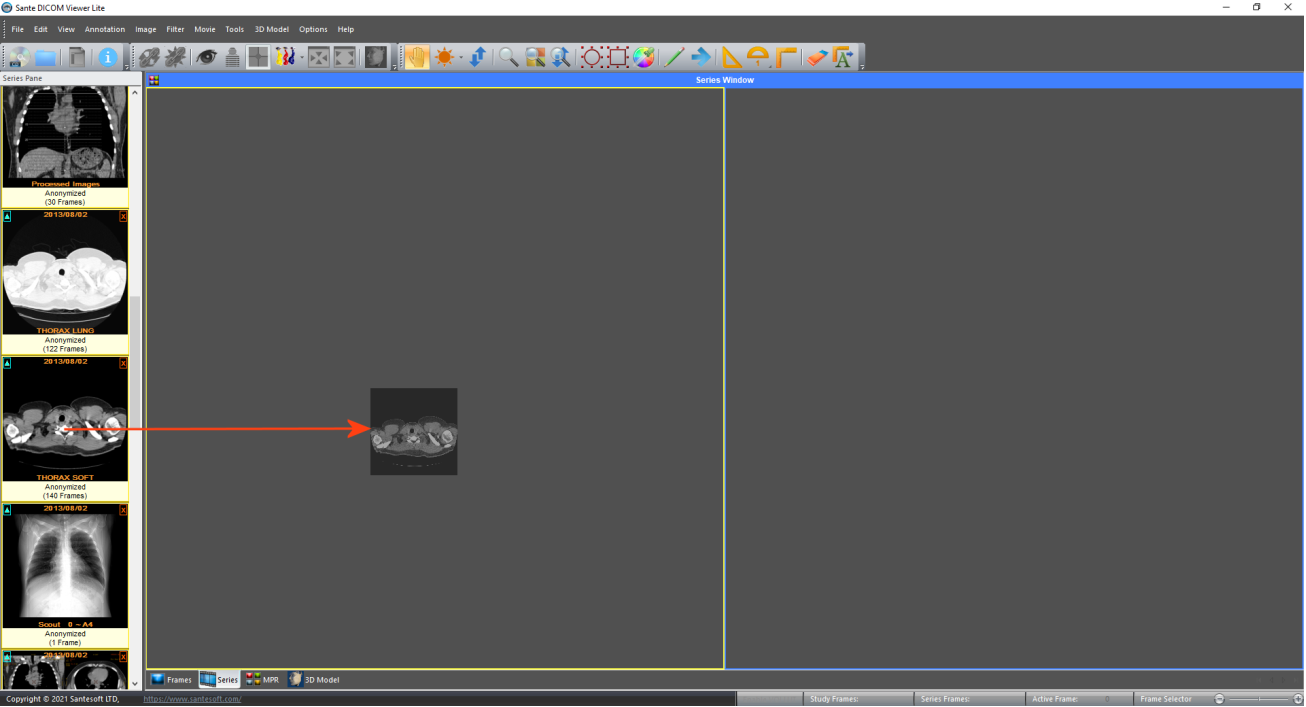
Drag and drop the desired series into two views.
You can synchronize the frames of the two series by selecting
the menu command "View |
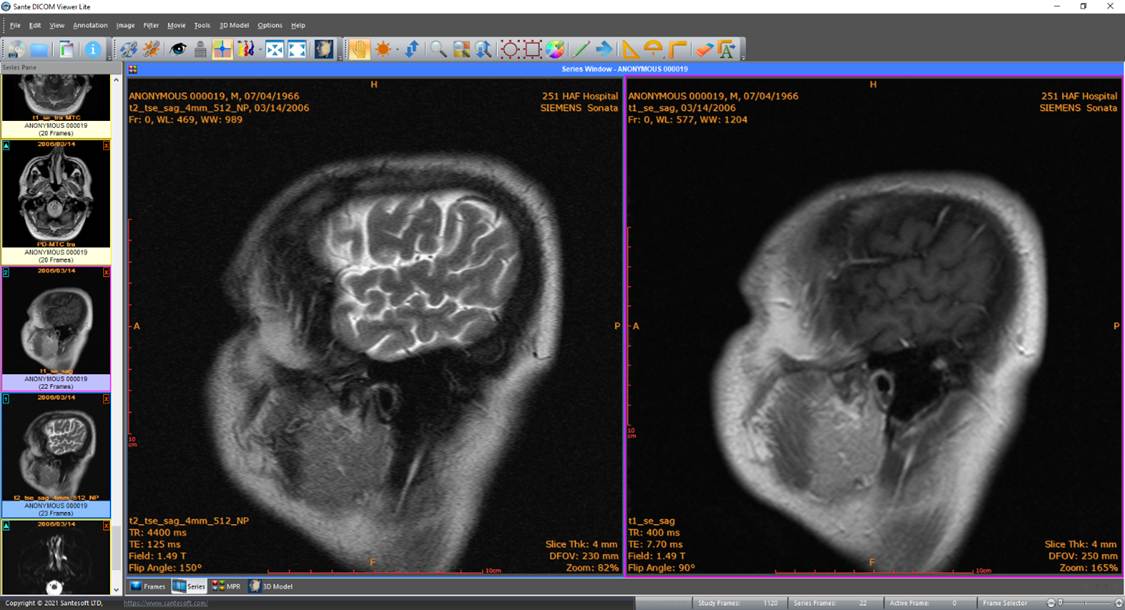
Compare Images from the Same Series
Open the series.
From the Tab control select the Series View.
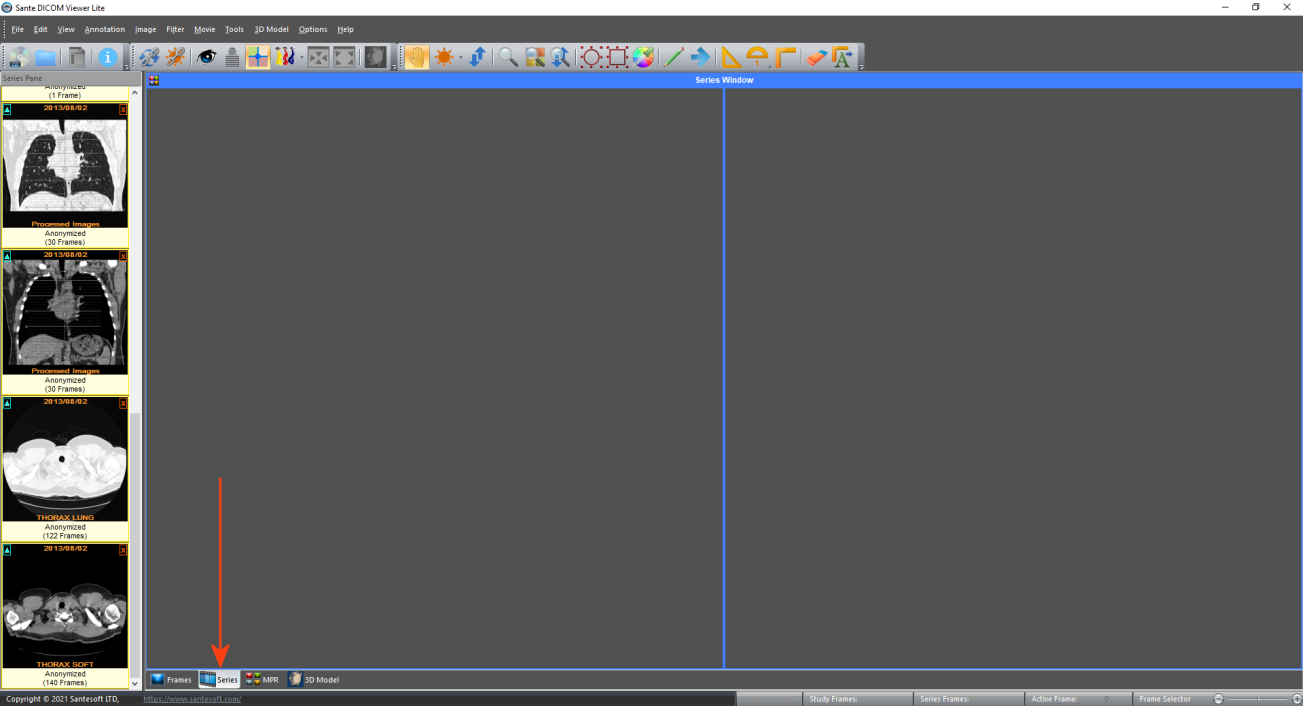
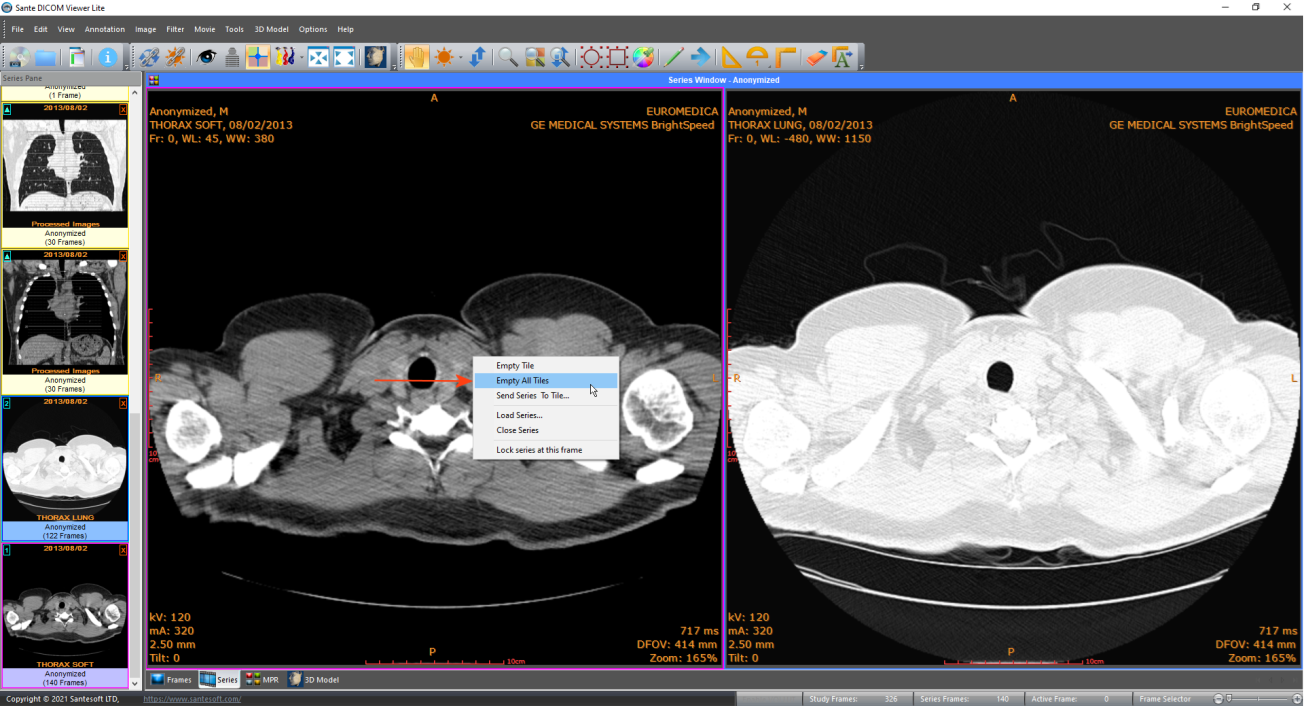
If series are already loaded in this window, press
the right mouse button and select the
"Empty All
Tiles"
command.
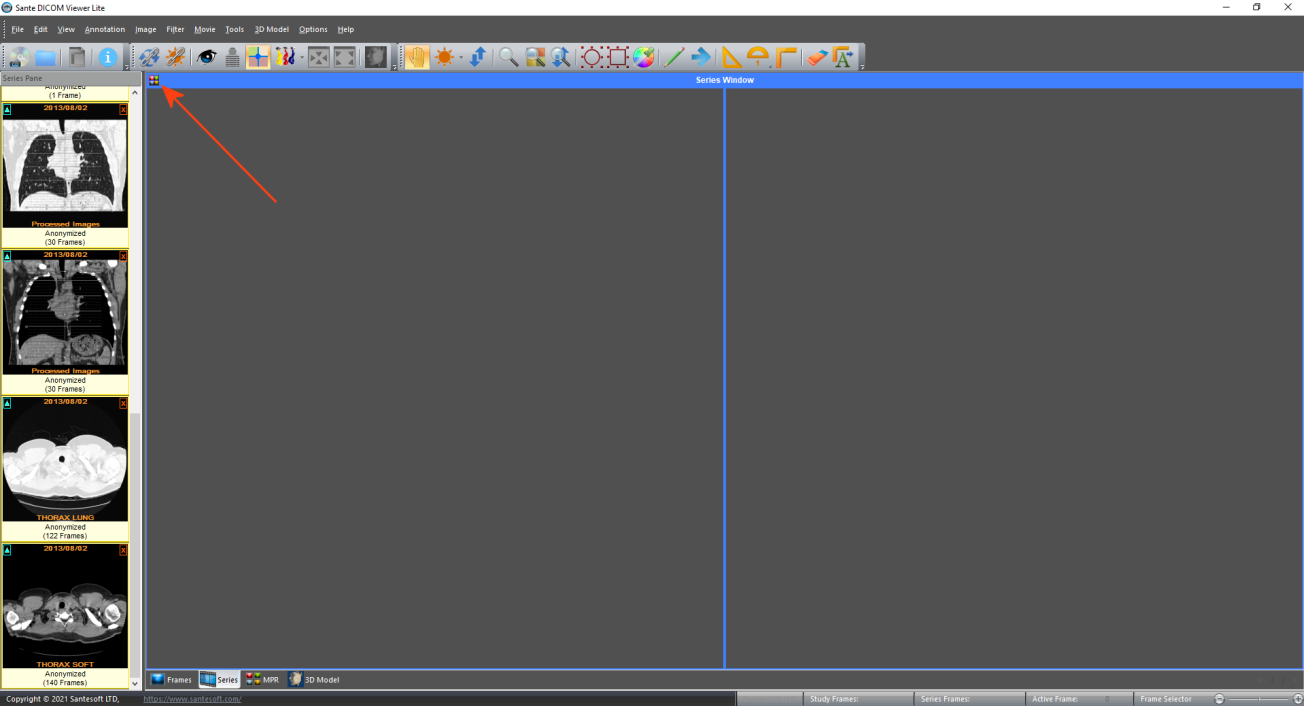
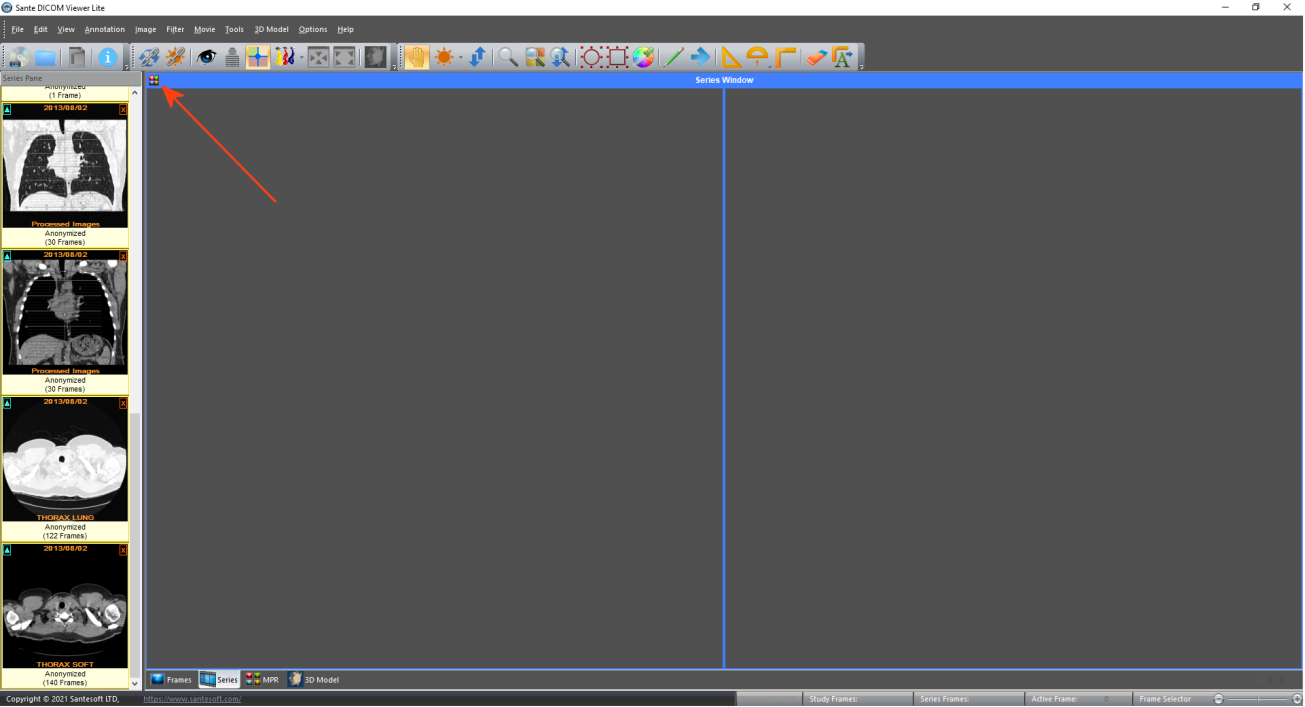
Select the menu command "Options Tiles Layout" or
press the "Tiles Layout" button in the upper-left
corner of the window.
Tiles Layout" or
press the "Tiles Layout" button in the upper-left
corner of the window.
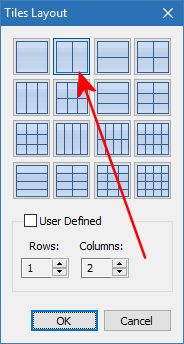
Select the two-column vertical layout.
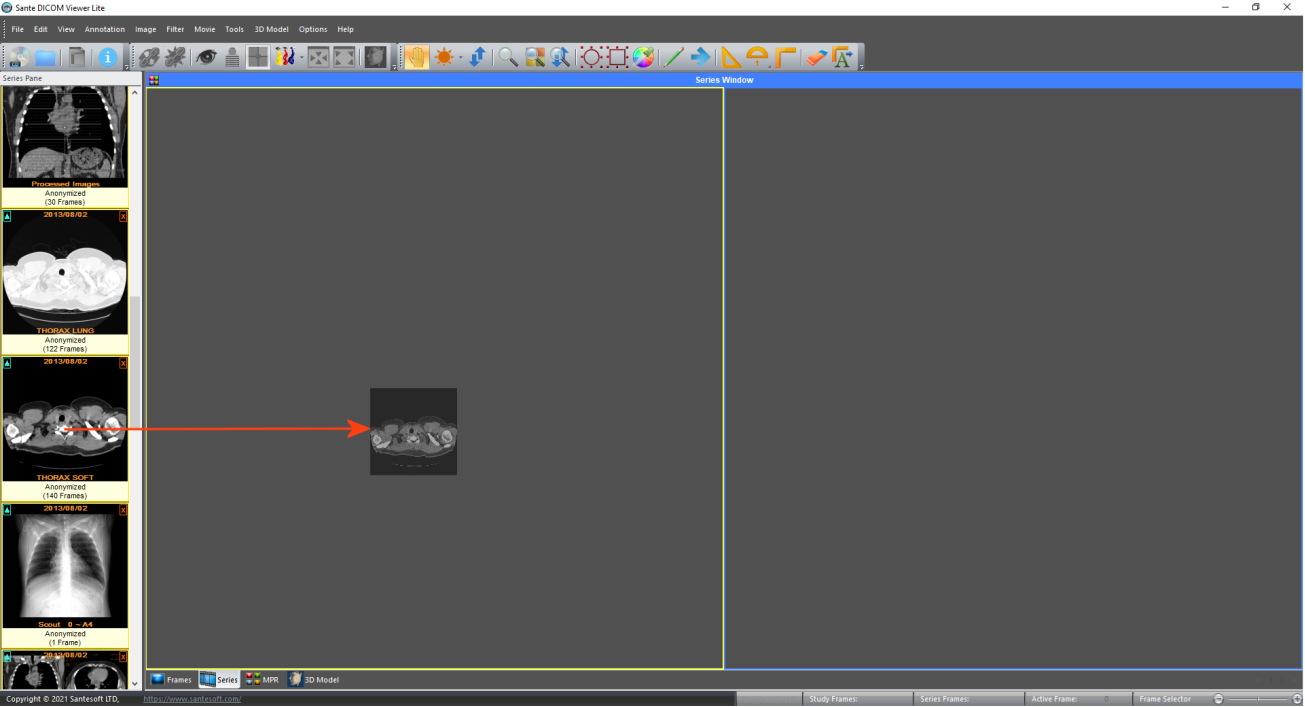
Drag and drop the same series into two views.
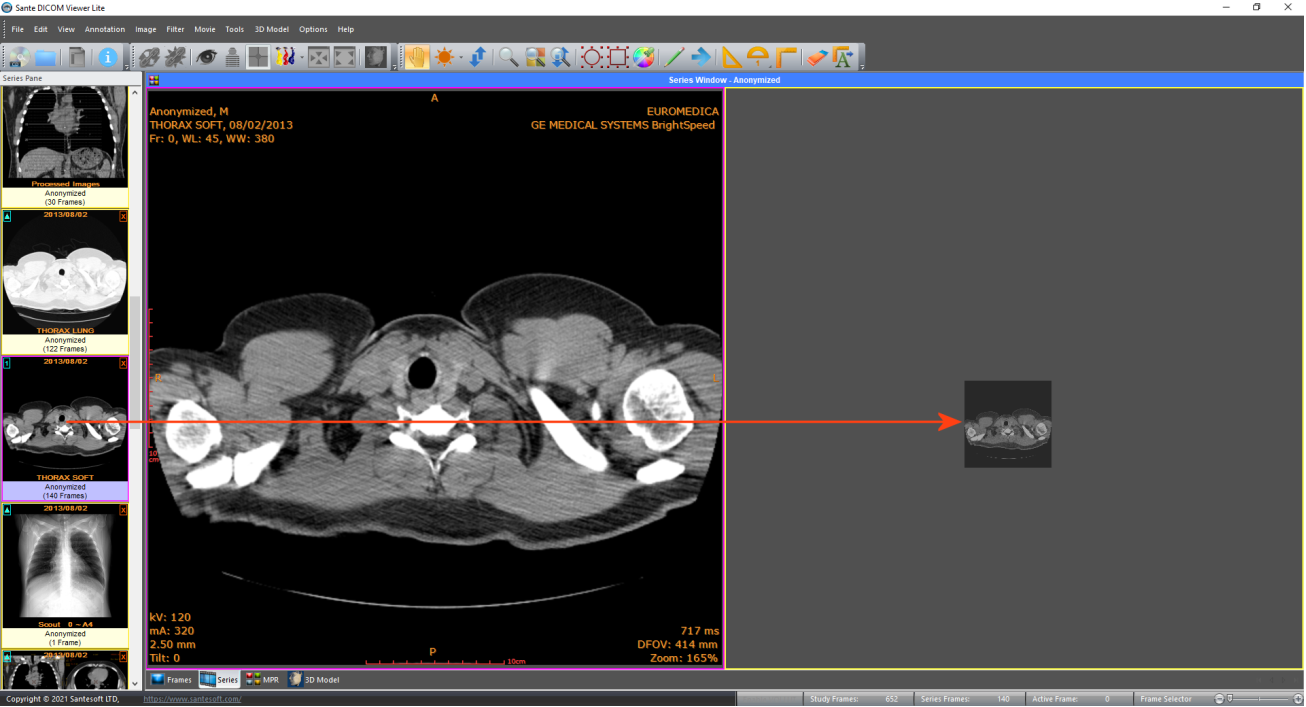
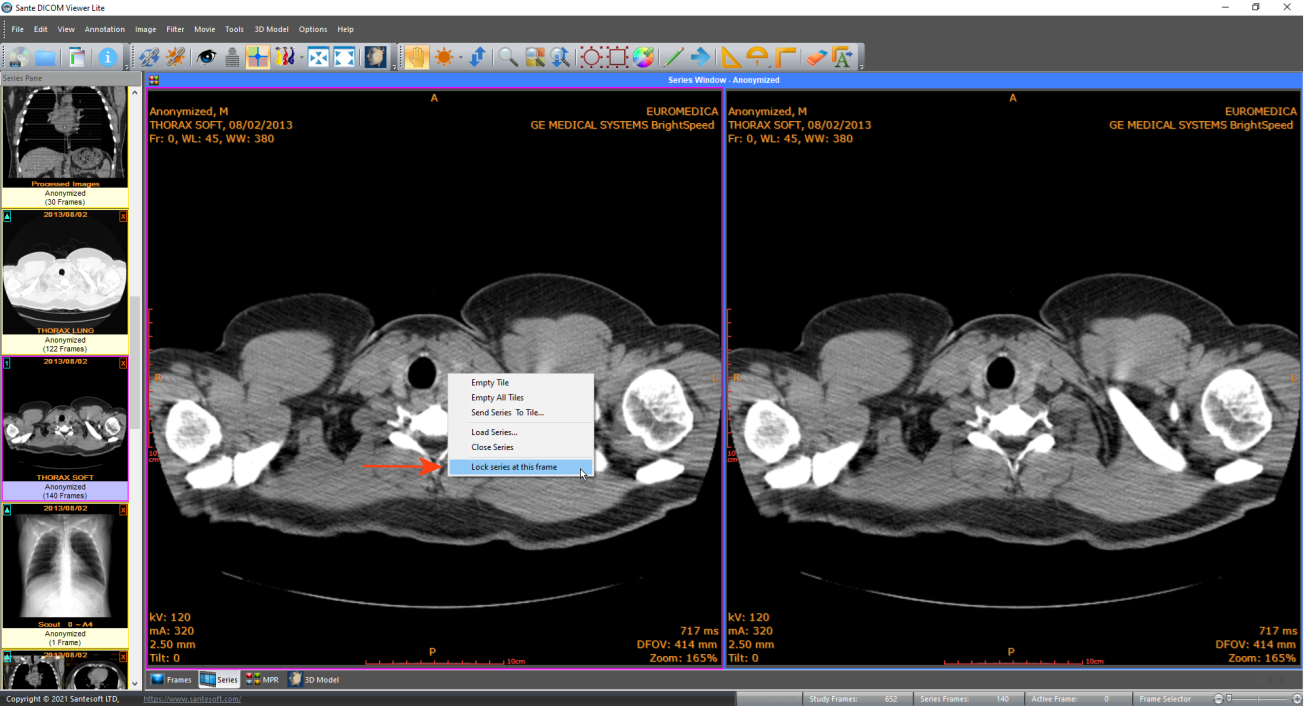
Scroll the series to the desired frame, press the right mouse
button and select the menu command
"Lock series at this
frame"
.
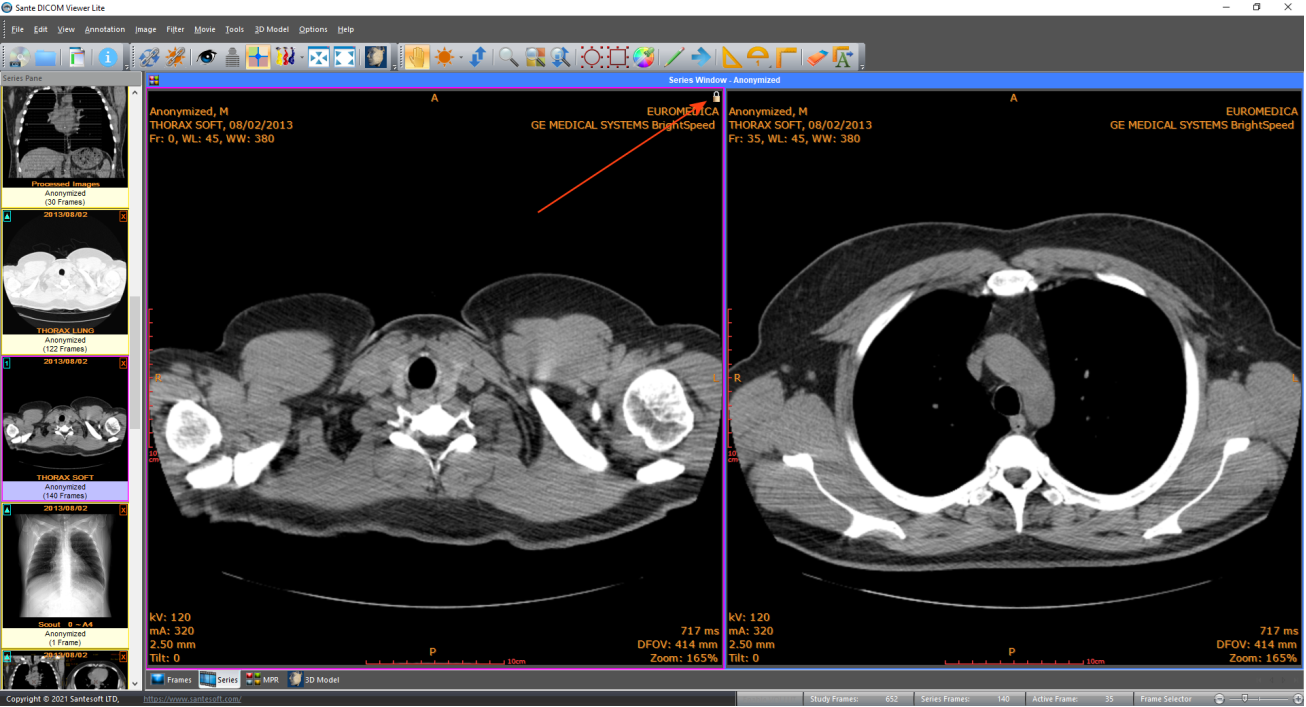
One series view is now locked at the desired frame,
and the other series view can scroll freely allowing you to compare different frames. The locked series displays a lock symbol in the upper-right
corner of the window.
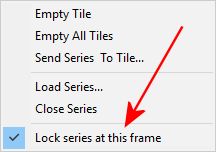
To unlock the series, press the right mouse
button and select the menu command again
"Lock series at this
frame"
.
Take Calibrated Ultrasound Measurements
The program supports the
Ultrasound Region Calibration Module (0018, 6011), and can perform
calibrated distance and area measurements in ultrasound DICOM files.
When the user selects the distance measurement tool, one or more rectangles
appear on the image. Each one of these rectangles represents a calibrated
region. The active region is green and the inactive regions are red. Within the active (green) region the mouse cursor is cross-shaped, and
within the inactive (red) region is arrow-shaped. The user can take
measurements in the active region.
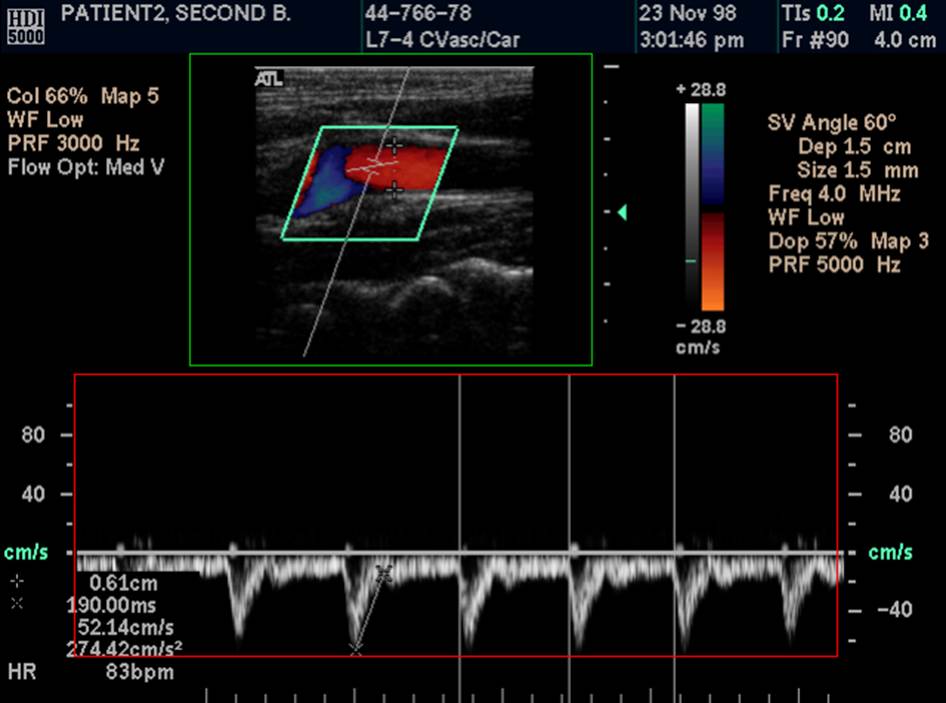
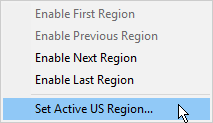
by right-clicking, a pop-up menu appears and allows the user
to select the active region.
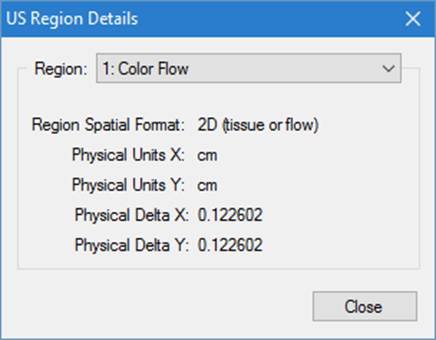
By selecting the menu command "View US Region Details...", a dialog
box appears and it displays the type, the units and the delta of the active
region.
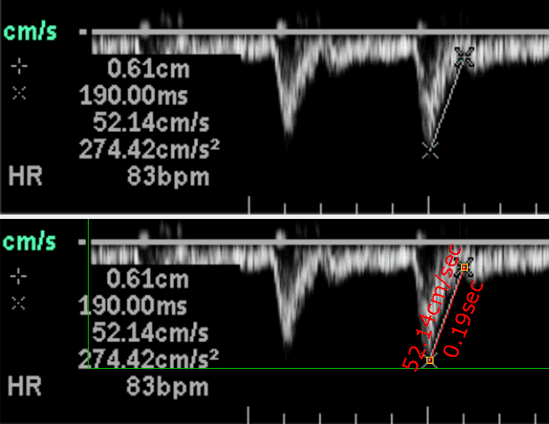
The user can easily check the accuracy of the measurements by taking the same measurement on the ultrasound system and in the program.
Program Options
Use the menu command “Options Other Options” to view
and adjust the options of the program.
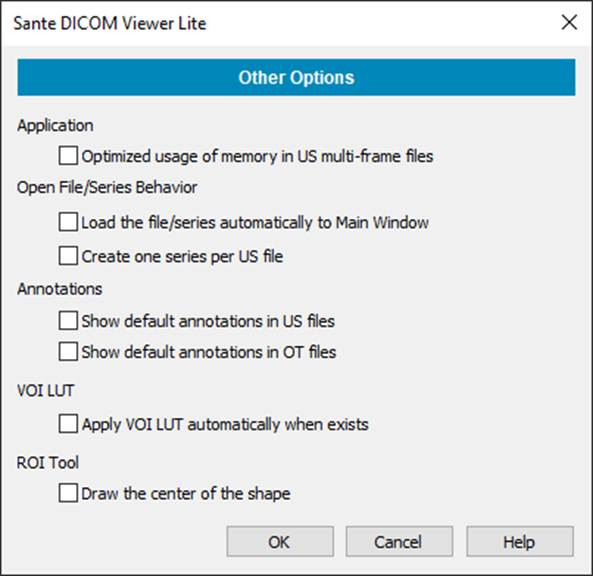
Optimized usage of memory in US multi-frame files
This option disables the program's Undo/Redo functions, which consume a large amount of memory in US multi-frame files.
With this option enabled, the program can handle larger US multi-frame files.
Load the file/series automatically to Main Window
If this option is enabled and the user opens a file/series, the program
automatically loads the file/series into the Main Window.
Create one series per US file
If this option is enabled, the program creates one series per US file and displays one thumbnail in the left-hand Series Pane
for every series. Otherwise it creates one series for all the US files that
belong to the same series and it displays one
thumbnail only in the left-hand series pane.
Show default annotations in US files
If this option is enabled, the program displays over the US images the patient's name
and date of birth, the series ID and date and other information.
Show default annotations in OT files
If this option is enabled, the program displays over the OT images the patient's name
and date of birth, the series ID and date and other information.
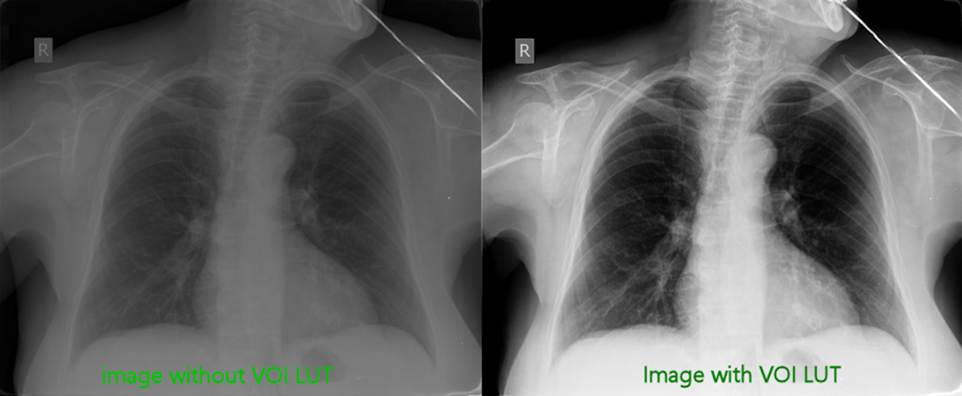
Apply VOI LUT automatically when available
If the file contains a VOI Lookup Table, the program displays the image with
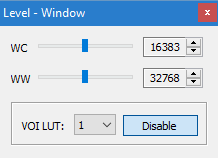
this LUT automatically.
If the file contains more than one VOI LUT, the user can select the active LUT
from the Level-Window Dialog Box
Draw the center of the shape
If this option is enabled, the program draws the center of the elliptical ROI.
Program Tools
Pan Hand
This tool allows you to pan across the image with the left mouse button when the image is larger than the screen. Click on the image and move your mouse in the direction you want to pan.

Level-Window
This tool allows
you to adjust the Level-Window values of the image using the left mouse button.

Click on the image and move your
mouse up and down to decrease or increase the level value, or move
your mouse left and right to decrease or increase the window value. The
level-window tool allows you to adjust the brightness and contrast of the
image without changing the actual pixel values; it changes only how the pixels are displayed on the screen.
The user can use the Level-Window
Dialog Box command in the View menu to enter precise
values in the level-window fields. The level-window tool does not work with
palette images.
Frame Browser
This tool allows
quick navigation through the frames of a multi-frame file or a multi-file
series.
Click on the image and move your
mouse down to view the next frames or up to view the previous frames.
Zoom In/Out
Use this tool to enlarge or reduce the image on your screen.

Click on the image to enlarge it by 10%. Press and hold the <Ctrl> key
and click on the image to reduce it by 10%.
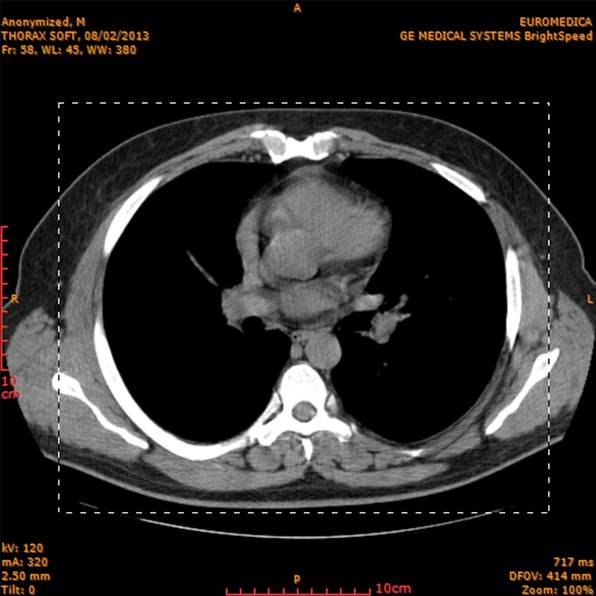
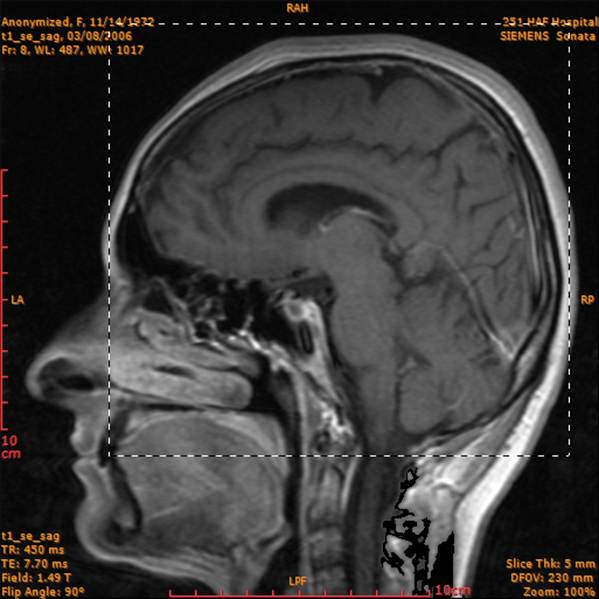
Zoom Window
Use this tool to
enlarge the desired field of view (FOV) on your screen.

Click on the upper-left corner of
the FOV and move your mouse toward the lower-right corner of the FOV. The program fits
the selected FOV to the screen.
Dynamic Zoom
Use this tool to
enlarge or reduce the image on your screen.

Click and hold the left mouse
button and move the mouse upward to enlarge the image.
Click and hold the left mouse
button and move the mouse downward to reduce the image.
ROI Tool
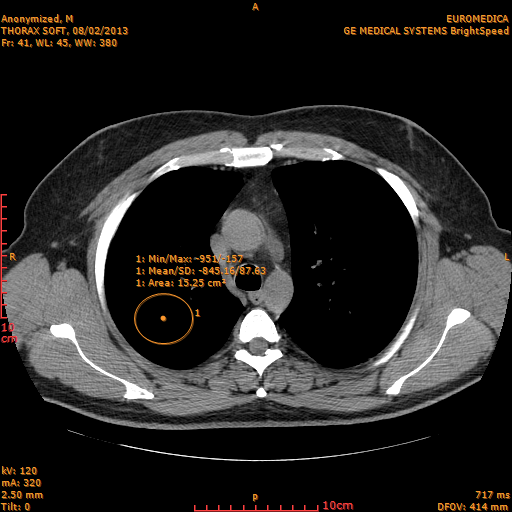
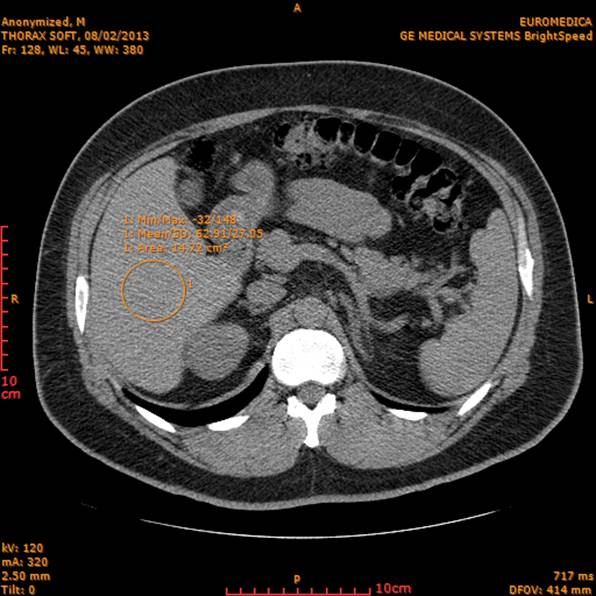
Use this tool to
select a circular area of the image.

The program displays a statistical
analysis of this area (minimum and maximum values, mean, standard
deviation, and area).
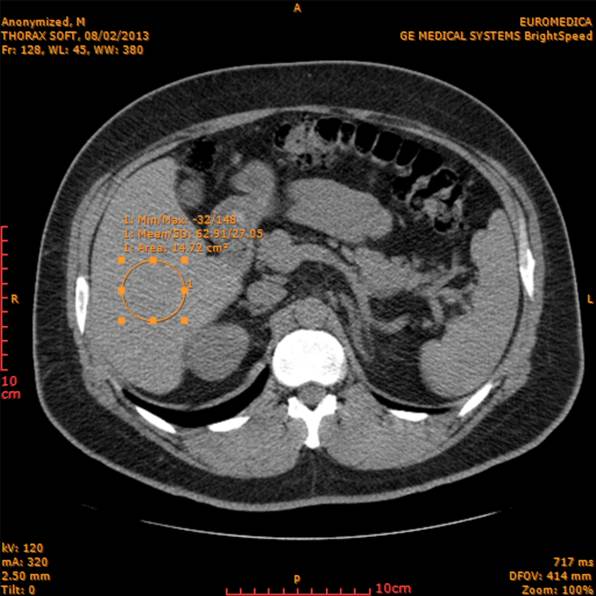
Press and hold the <Ctrl> key,
click on the text of the ROI and move it to change the position of the text.
Press and hold the <Ctrl> key,
click on an edge of the ROI and move it to change the shape of the ROI.
Press and hold the <Ctrl> key,
click on the center of the ROI and move it to change the position of the ROI.
Press and hold the <Shift> key
and click on an edge of the ROI to delete the ROI.
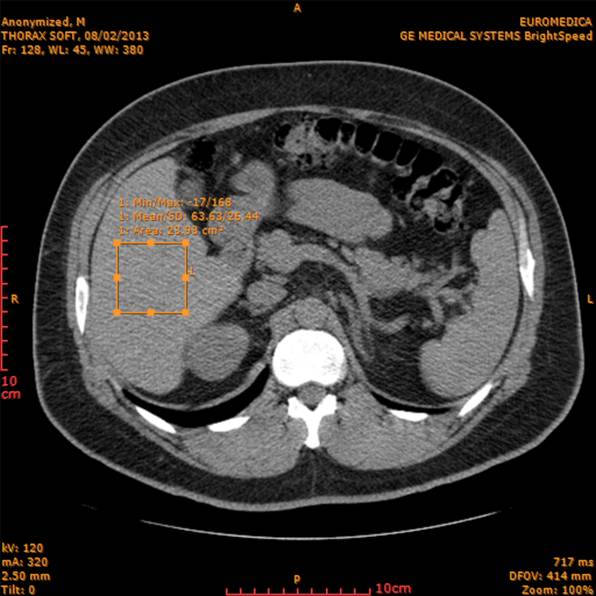
Rectangular ROI Tool
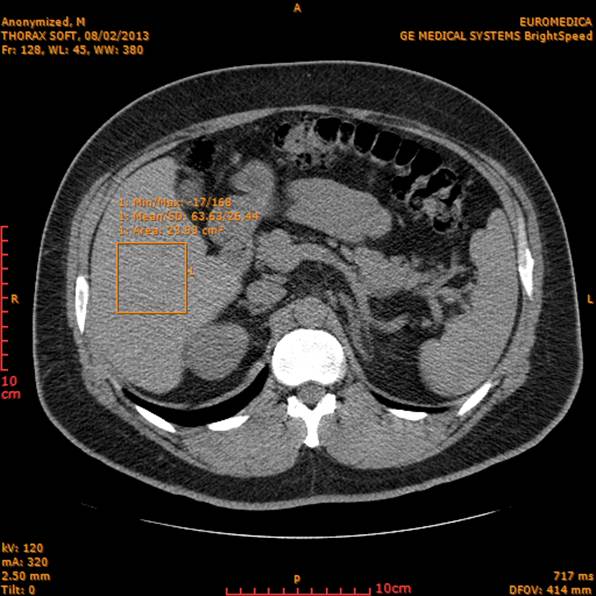
Use this tool to
select a rectangular area of the image.
The program displays a statistical
analysis of this area (minimum and maximum values, mean, standard
deviation, and area).
Press and hold the <Ctrl> key,
click on the text of the ROI and move it to change the position of the text.
Press and hold the <Ctrl> key,
click on an edge of the ROI and move it to change the shape of the ROI.
Press and hold the <Ctrl> key,
click on the center of the ROI and move it to change the position of the ROI.
Press and hold the <Shift> key
and click on an edge of the ROI to delete the ROI.
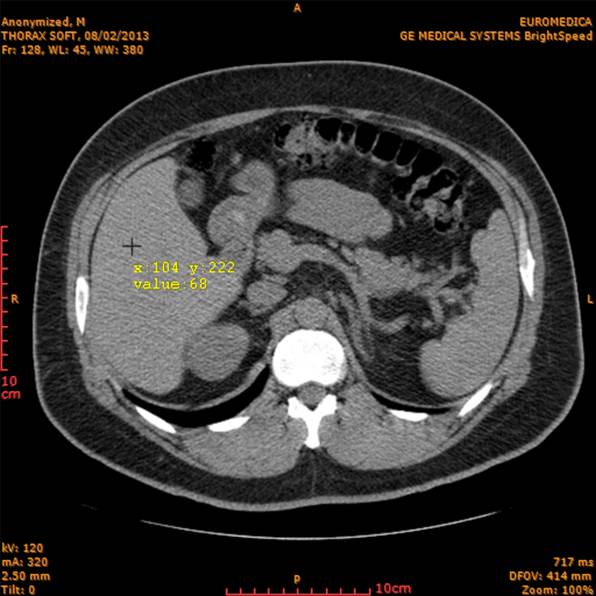
Intensity/Color Picker Tool
Use this tool to
get the intensity (or color, for color images) and the x and y coordinates of an
individual pixel.

Annotation Text
This tool allows you to insert, modify, and delete an annotation text on the image.

Select this tool
and click on a point of the image. A dialog box appears and lets you enter
the annotation text at that point.
The "Add Annotation"
dialog box
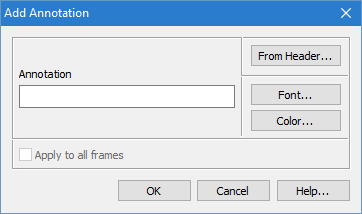
From Header button
Allows you to select text from the
file's header.
Font button
Allows you to select the font of the
text.
Color button
Allows you to select the color of
the text.
To move an
annotation/measurement, press and hold down the <Ctrl> key,
click on the annotation/measurement, and move it around the image. You can move
an annotation/measurement with the Move Annotation/Measurement tool as well.
To delete an
annotation arrow, press and hold down the <Shift> key,
and click on the annotation/measurement.
You can delete an
annotation/measurement with the Erase Annotation/Measurement tool as
well.
Annotation Arrow
This tool allows you to insert, modify, and delete an annotation arrow on the image.

To move an
annotation/measurement, press and hold down the <Ctrl> key,
click on the annotation/measurement, and move it around the image. You can move
an annotation/measurement with the Move Annotation/Measurement tool as well.
To delete an
annotation arrow, press and hold down the <Shift> key,
and click on the annotation/measurement.
You can delete an
annotation/measurement with the Erase Annotation/Measurement tool as
well.
Measure Distance
The distance
measurement tool allows you to measure distances on the image. You
can select the units of the measurements from the options menu.

To move an
annotation/measurement, press and hold down the <Ctrl> key,
click on the annotation/measurement, and move it around the image. You can move
an annotation/measurement with the Move Annotation/Measurement tool as well.
To delete an
annotation arrow, press and hold down the <Shift> key,
and click on the annotation/measurement.
You can delete an
annotation/measurement with the Erase Annotation/Measurement tool as
well.
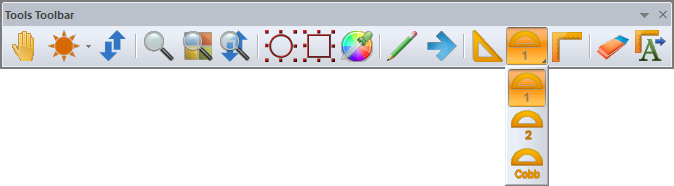
Measure Angle (Vertex: 1st point)
The angle
measurement tool allows you to measure angles on the image.
To move an
annotation/measurement, press and hold down the <Ctrl> key,
click on the annotation/measurement, and move it around the image. You can move
an annotation/measurement with the Move Annotation/Measurement tool as well.
To delete an
annotation arrow, press and hold down the <Shift> key,
and click on the annotation/measurement.
You can delete an
annotation/measurement with the Erase Annotation/Measurement tool as
well.
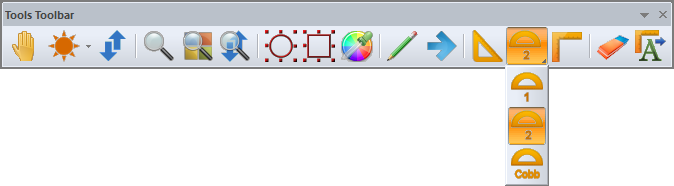
Measure Angle (Vertex: 2nd point)
The angle
measurement tool allows you to measure angles on the image.
To move an
annotation/measurement, press and hold down the <Ctrl> key,
click on the annotation/measurement, and move it around the image. You can move
an annotation/measurement with the Move Annotation/Measurement tool as well.
To delete an
annotation arrow, press and hold down the <Shift> key,
and click on the annotation/measurement.
You can delete an
annotation/measurement with the Erase Annotation/Measurement tool as
well.
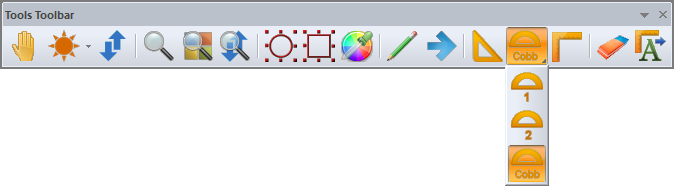
Measure Cobb Angle
The angle
measurement tool allows you to measure Cobb angles on the image.
Click the first point and then
click the second point to create the first side of the Cobb angle.
Click the third point and then
click the fourth point to create the second side of the Cobb angle.
The program calculates and displays
the value of the Cobb angle.
To move an
annotation/measurement, press and hold down the <Ctrl> key,
click on the annotation/measurement, and move it around the image. You can move
an annotation/measurement with the Move Annotation/Measurement tool as well.
To delete an
annotation arrow, press and hold down the <Shift> key,
and click on the annotation/measurement.
You can delete an
annotation/measurement with the Erase Annotation/Measurement tool as
well.
Polyline
The polyline
measurement tool allows you to measure lengths and perimeters on the
image.
You can select the units of the
measurements from the options menu.

To end the polyline, double-click the last point.
Right-click the image to end the
polyline without inserting the last (floating) point.
To move an
annotation/measurement, press and hold down the <Ctrl> key,
click on the annotation/measurement, and move it around the image. You can move
an annotation/measurement with the Move Annotation/Measurement tool as well.
To delete an
annotation arrow, press and hold down the <Shift> key,
and click on the annotation/measurement.
You can delete an
annotation/measurement with the Erase Annotation/Measurement tool as
well.
Erase Annotation/Measurement
This command
enables the erase annotation tool.
Use the erase annotation tool to
delete an annotation text, arrow, distance or angle measurement. When the
eraser is over an annotation object, its color is white and you can delete
the object by left-clicking it. Otherwise, its color is black.

Move Annotation/Measurement
The move annotation tool allows you to select and/or move an annotation (text, arrow, distance, angle, ROI, and rectangular ROI).
